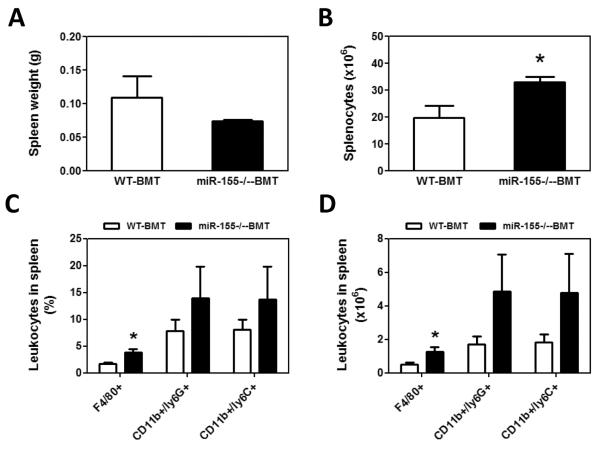
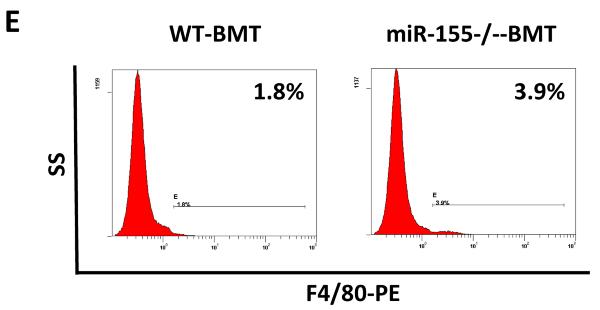
Figure 3.
Increased accumulation of macrophages in the speens of miR-155−/− chimeric mice. Spleen weight (A) and total splenocytes (B) were calculated and shown. The percentage of leukocytes in spleen from WT and miR-155−/− chimeric mice was analyzed by flow cytometry using antibodies for specific surface markers (C); and the absolute number of leukocytes in spleen was calculated (D). Data were presented as the mean ± SEM of 8 mice. *p<0.05 by Student's t test. E, Representative flow cytometric dot plot of F4/80 macrophages in spleen. Percentages indicate mean values in each group.


