Figure 5.

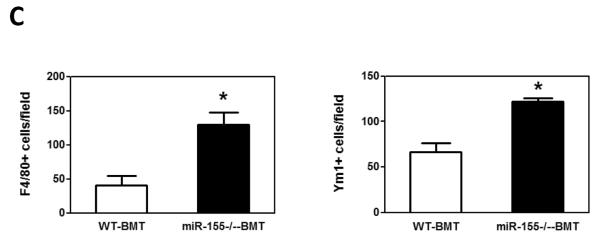
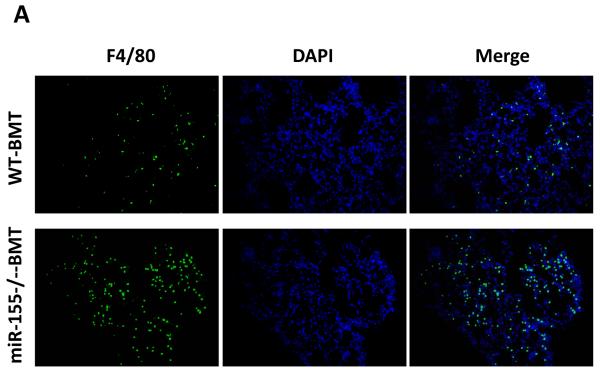
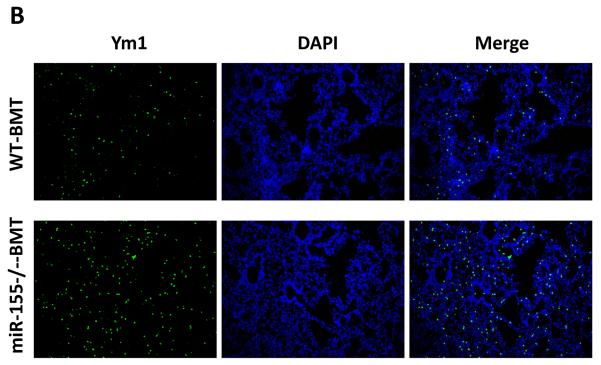
Elevated macrophage infiltration in the lungs of miR-155−/− chimeric mice. Representative fluorescence images of lung tissues from WT and miR-155−/− chimeric mice immunostained for F4/80 (A) (using FITC-conjugated rat anti-F4/80 antibody) and Ym1 (B) (using rabbit anti-mouse YM1 polyclonal antibody and Alexa Fluor 488-conjugated secondary antibody). Sections were counterstained with DAPI nuclear dye (in blue). A, magnification, 20 x; B, magnification, 10 ×; C, The numbers of F4/80 (left panel) or Ym1 (right panel) positive cells were counted in 6–12 random fields per section and the average was used for the calculation. Data are presented as the mean ± SEM of 8 mice. *p<0.05 by Student's t test.


