Figure 6.
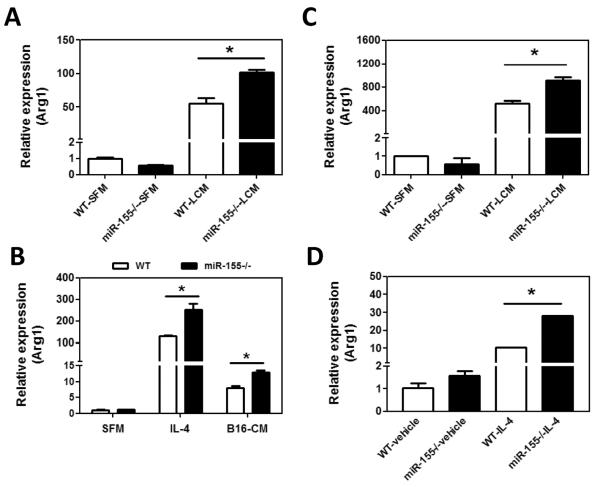
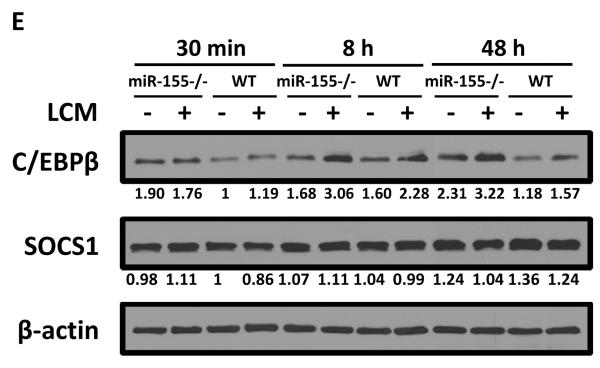
miR-155−/− macrophages exhibit M2 phenotype. Quantitative real-time PCR analysis of Arg1 mRNA levels in WT and miR-155−/− macrophages incubated with SFM or LCM for 24 h (A) and in WT and miR-155−/− macrophages incubated with IL-4 (20 ng/ml) or B16-CM for 24 h (B). BMDM from WT and miR-155−/− mice were incubated with LCM (C) and IL-4 (D) for 24 h and Arg1 mRNA level was detected by quantitative real-time PCR. Data are presented as the mean ± SEM of three replicates. *, p<0.05 by Student's t test. E C/EBPβ is responsible for M2 polarization of miR-155−/−macrophages. WT and miR-155−/− macrophages were treated with SFM or LCM for 30 min, 8 h and 48 h; expression of C/EBPβ, SOCS1, and β–actin proteins was determined by Western blotting. β–actin was used as a loading control. The numbers under the protein bands indicate the normalized relative intensity; the band intensity relative to β–actin of the untreated WT sample at 30 min time-point was set as 1. Representative data from three independent experiments are shown.


