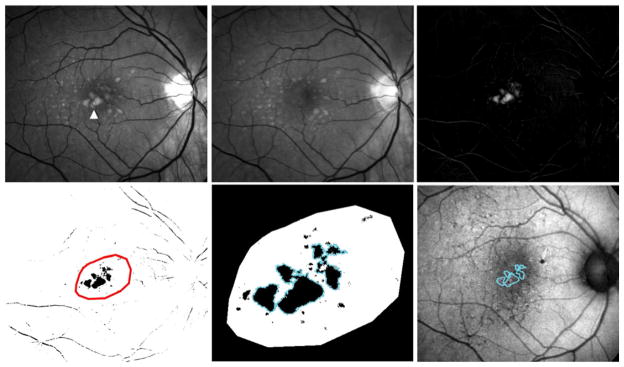
Figure 1. Computer-assisted delineation of areas of drusen regression over two years in eyes with intermediate age-related macular degeneration.

(top left, top middle) Normalized red-free monochromatic images of a study eye with intermediate age-related macular degeneration and large drusen captured at baseline (top left) and at year 2 (top middle). Multiple large drusen at the center of the macula (arrowhead) visible at baseline have undergone regression and cannot be visualized at year 2. (top right) Subtraction image between baseline and year 2 that generates an image of the regressing drusen. (bottom left) Inversion and binarization of the image shown in (top right). The areas of relevant drusen regression were highlighted manually for further processing (red outline). (bottom middle) Expanded image of the inset shown in (bottom left) demonstrating automated delineation of individual regions-of-interest (ROIs) of drusen regression (blue outline). ROIs of areas smaller than the area of circle C1 were excluded. (bottom right) Drusen regression ROIs (blue outlines) were superimposed on co-registered autofluorescence images captured at baseline and year 2 for further grading and analysis.
