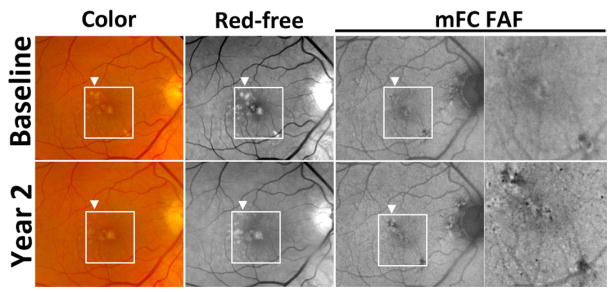
Figure 4. Example of drusen regression over two years in intermediate age-related macular degeneration in Study Participant 2.

Color (top left, bottom left), red-free monochromatic (top middle, bottom middle) fundus photographs, and fundus autofluorescence (FAF) (top right, bottom right) images at baseline (top row) and year 2 (bottom row) demonstrate two adjacent areas of drusen regression in the macula (highlighted by arrowhead and box). While the areas of drusen regression are of normal appearance on red-free photography (bottom middle), subtle trace pigmentary changes were observed on color photography (bottom left). However, on autofluorescence imaging, distinct areas of decreased FAF signal were localized to areas of drusen regression (bottom right and inset) that were not present at the baseline visit (top right and inset).
