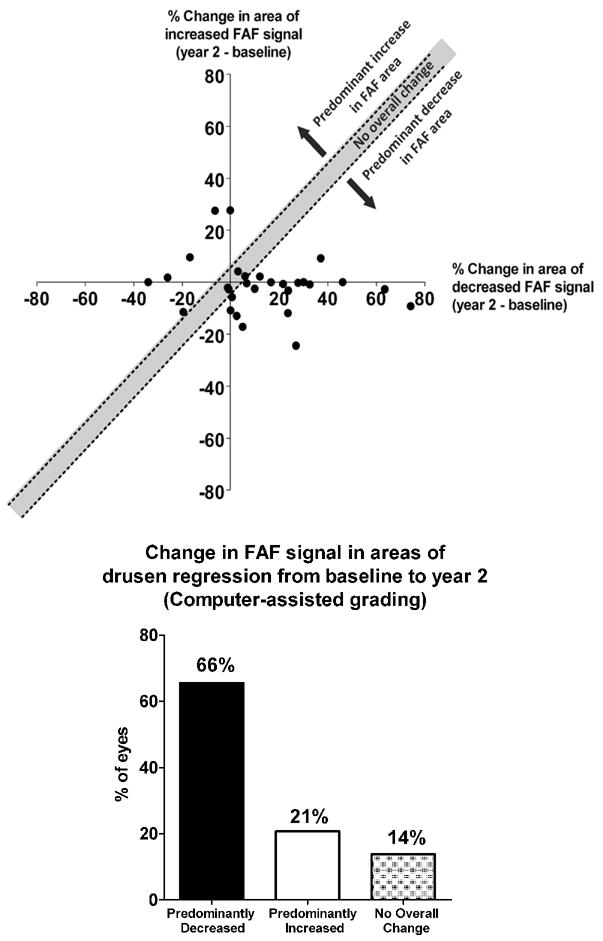
Figure 7. Computer-assisted grading of fundus autofluorescence changes in areas of drusen regression over two years in intermediate age-related macular degeneration.

Study eyes that met image-processing criteria for drusen regression (n = 29) were evaluated for changes in fundus autofluorescence (FAF) signals in drusen-regression regions of interest (ROIs). The areas of decreased FAF and increased FAF within drusen-regression ROIs in each eye were determined at baseline and at year 2, and the changes from baseline to year 2 calculated and plotted on a common graph. (top) Graph showing the percentage change in the area of increased FAF (y-axis) plotted against the percentage change in the area of decreased FAF (x-axis) with each eye represented as an individual point (n = 29). Eyes that demonstrated changes in area that were well-matched between increased FAF and decreased FAF (±5%) are represented by points that lie within the y=x (±5%) zone (unshaded region) which indicates “no overall changes” in general FAF. Eyes in which the change in the area of increased FAF exceeded the change in the area of decreased FAF change are represented by points lying above the unshaded zone (green region) and were considered to have “predominantly increased FAF.” Eyes in which the change in the area of decreased FAF exceeded the change in the area of increased FAF change are represented by points lying below the unshaded zone (red region) and were considered to have “predominantly decreased FAF.” (bottom) The distribution of eyes demonstrating different overall changes in FAF as defined in (top) shows that a majority of eyes (66%) exhibited significant decreases in overall FAF in the regions where drusen have regressed.
