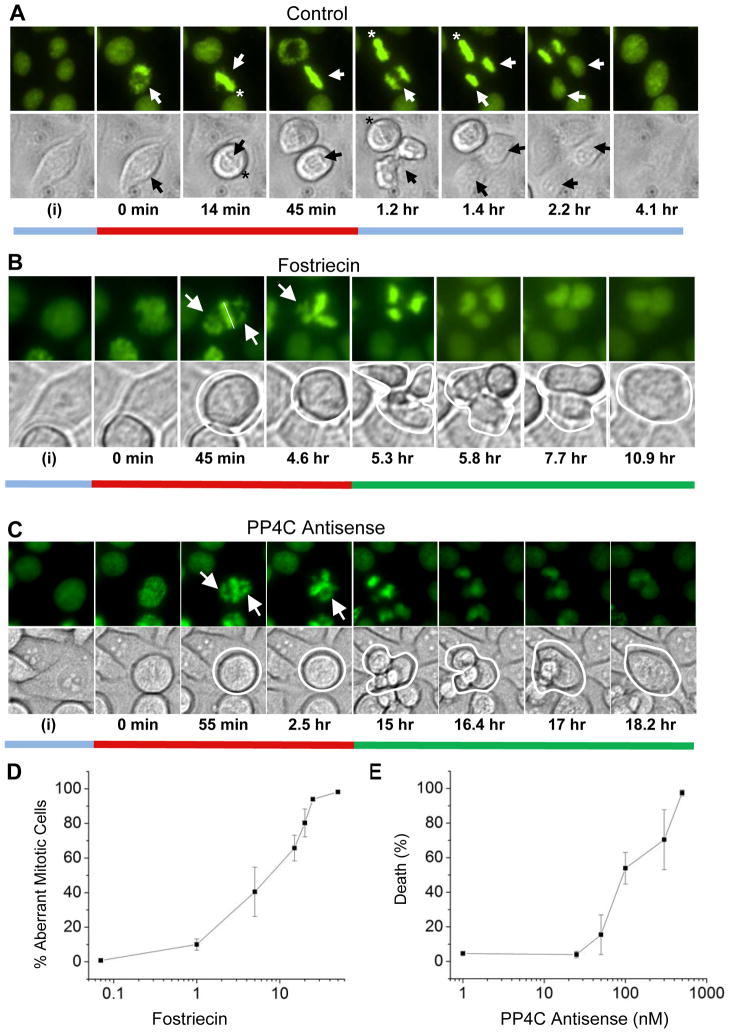
Figure 1. Localization of H2B-GFP protein in HeLa cells.
Fluorescent and corresponding differential interference contrast (DIC) microscopic images of selected HeLa-H2B-GFP cells representing the typical behavior of the populations are shown at various phases of the cell cycle. A) Representative images selected from time-lapse live cell imaging of control cells typical of: interphase at the start of recording (i), the start of mitotic entry (set at 0 min), pro-metaphase (14 min), metaphase (45 min), anaphase (1.2–1.4 hr), chromosome decondensation (2.2 hr) and after the completion of cytokinesis (4.1 hr). Elapsed time from the start of mitotic entry is indicated below image pairs. B) Images showing selected cells that represent the typical behavior of populations after treatment with 50 μM fostriecin. No effects were observed prior to entry into mitosis (0 min). During a prolonged mitosis, condensed chromosomes fail to align properly at the metaphase plate (45 min; 4.6 hr). Subsequently, chromosomes segregated into unequal clusters (5.3 hr) and undergo decondensation (5.8 hr). During this period more than one furrow appears (5.3 hr; 5.8 hr and 7.7 hr). Then the furrows undergo regression (shown here at 10.9 hrs). C) Images showing selected cells that represent the typical behavior of populations after treatment with antisense oligonucleotides targeting PP4C. H2B-GFP expressing HeLa cells were treated with 400 nM ISIS 134947. After 24 hours, time-lapse imaging studies were conducted for 48 hours as above. The similarity to the effects produced by fostriecin are striking: PP4C-AS interferes with the integrity of the metaphase plate (55 min) prolongs mitosis, and allows cleavage furrow regression following mitotic slippage (shown at 18.2 hr). The data shown is representative of > 4 separate experiments in which 50–100 mitotic cells were scored in each experiment. Bars under figure pairs are colored to illustrate images representing various stages of cell cycle progression and are color matched to the quantitative data shown in Figure 2. D) Concentration dependent increase in fostriecin-mediated failure of chromosome alignment at the metaphase plate. HeLa-H2B-GFP cells were treated with the indicated concentration of fostriecin or solvent (controls). After 24 hours fluorescent images of random fields were taken, and 50–100 mitotic cells were examined for the presence of condensed chromosomes that failed to align properly at the metaphase plate. The data shown represent the mean +/− SD from three separate experiments. E) Dose-dependent cell death following treatment with antisense targeting PP4C. HeLa cells were treated with the indicated concentration of ISIS 14376, and cell viability was determined after 72 hours. For each experiment random fields were examined and 100 cells were scored for by the ability to exclude trypan blue. The data is plotted as death (%) as compared to death in cells treated with miss-matched antisense oligonucleotides and represents the mean +/− SD (n=3).

