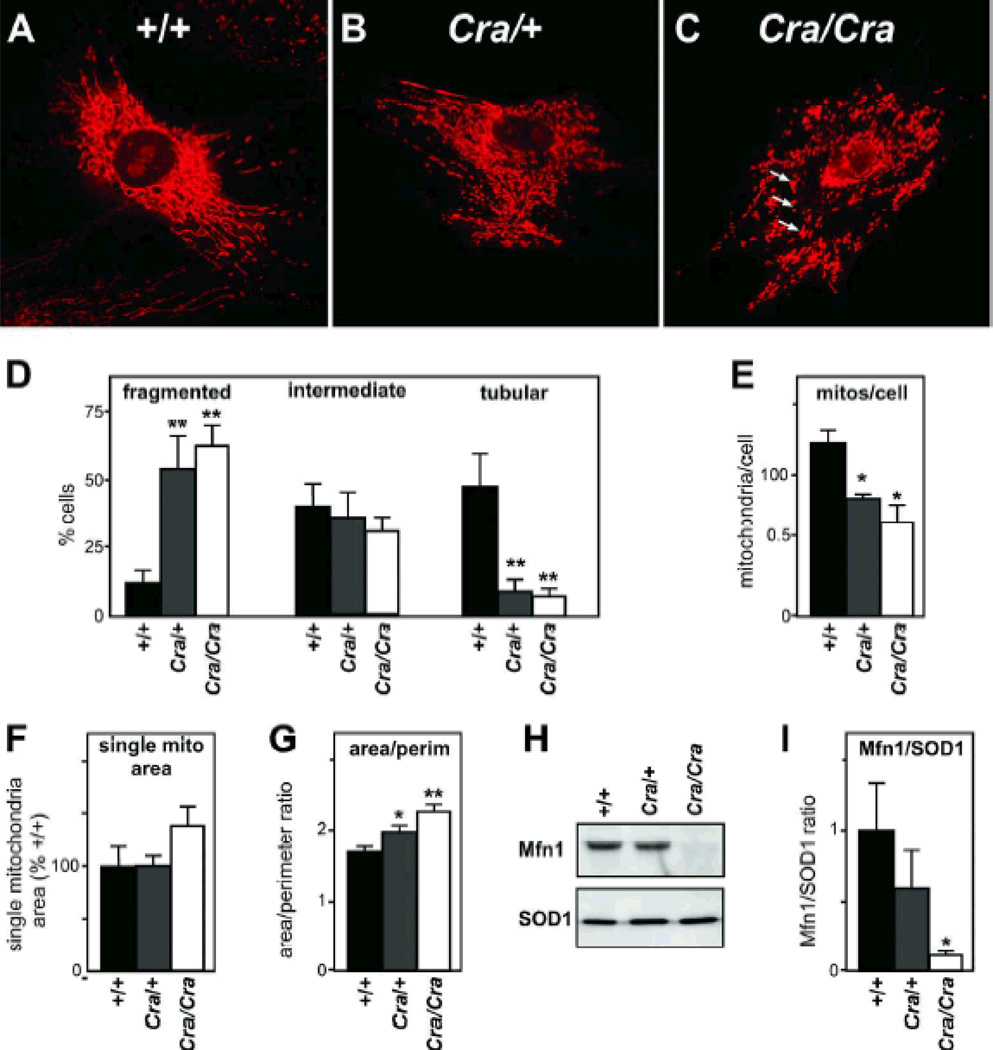
Figure 1. abnormal mitochondrial morphology and loss of Mfn1 in Cramping mutant MEFs.
A-C- Representative microphotograph of Mitotracker staining in +/+ (A), Cra/+ (B) and Cra/Cra (C) MEFs. Note the fragmentation of the mitochondrial network and the perinuclear aggregates resembling mitoaggresomes (arrows in C). D- Fraction of cells presenting with fragmented (left), intermediate (middle) or tubular (right) mitochondrial network. n=9–12 embryos per condition, at least 25 cells were analyzed per embryo; **, p<0.01 vs corresponding +/+, ANOVA followed by Newman-Keuls post-hoc test.
E-G- Semi-automated morphometric analysis of mitochondrial shape determining the number of individual mitochondria (E), the surface of individual mitochondria (F), and the surface to perimeter (S/P) ratio of individual mitochondria as an index of the shape. The lower is the S/P ratio, the closer to circle is the mitochondria. Note that the dync1h1 mutation leads to decreased individualized mitochondria and increased S/P ratio demonstrating more compact mitochondria. *, p<0.05; **, p<0.01 vs corresponding +/+, ANOVA followed by Newman-Keuls post-hoc test.
H-I Representative western blotting showing Mitofusin 1 (Mfn1) and SOD1 levels in +/+, Cra/+ and Cra/Cra MEFs. n=3 embryos per genotype analyzed. Panel I presents the quantification of the experiments. *, p<0.05; vs corresponding +/+, ANOVA followed by Newman-Keuls post-hoc test.

