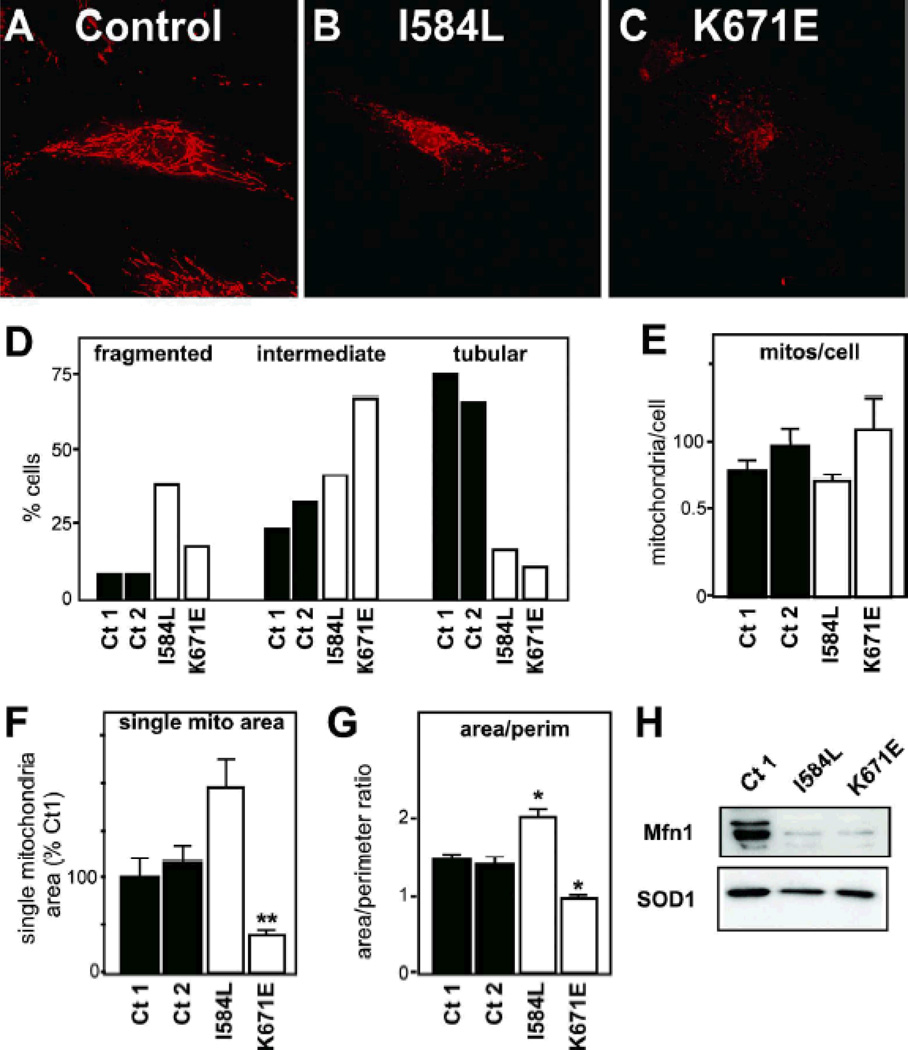
Figure 5. abnormal mitochondrial morphology and loss of Mfn1 in SMA-LED fibroblasts.
A-C- Representative microphotograph of Mitotracker staining in healthy control (A), I584L (B) and K671E (C) dync1h1 mutant patients. Note the fragmentation of the mitochondrial network.
D- Fraction of cells presenting with fragmented (left), intermediate (middle) or tubular (right) mitochondrial network. At least 25 cells were analyzed per patient. The distribution of I584L dync1h1 and K671E dync1h1 mutant is different from both controls as judged from Chi2 tests.
E-G- Semi-automated morphometric analysis of mitochondrial shape determining the number of individual mitochondria (E), the surface of individual mitochondria (F), and the surface to perimeter (S/P) ratio of individual mitochondria as an index of the shape. The lower is the S/P ratio, the closer to circle is the mitochondria. *, p<0.05; **, p<0.01 vs healthy controls, ANOVA followed by Newman-Keuls post-hoc test.
H- Representative western blotting showing Mitofusin 1 (Mfn1) and SOD1 levels in healthy control, I584L and K671E dync1h1 mutant patients. n=3 experiments.

