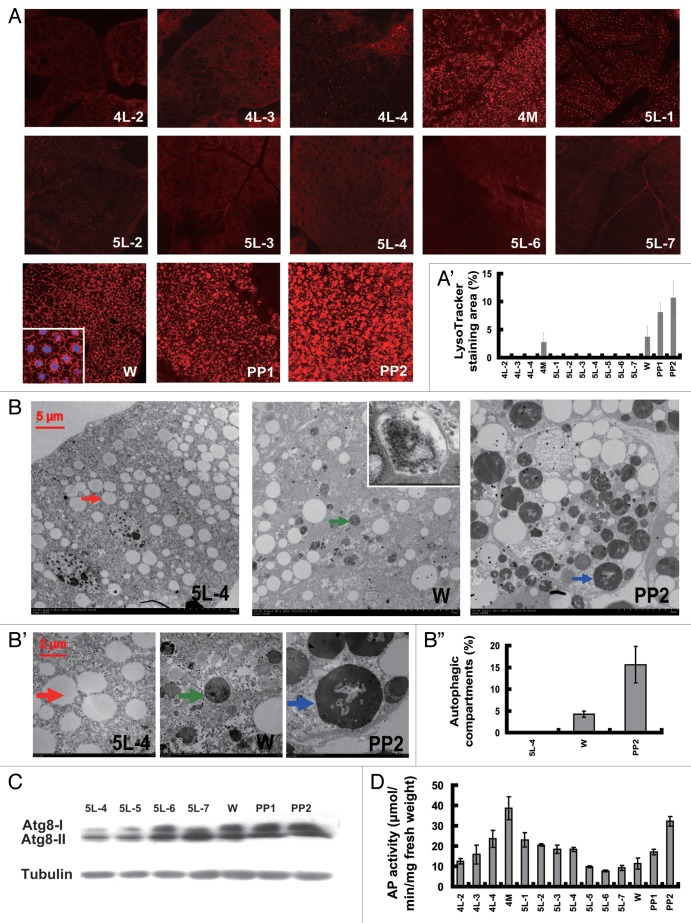
Figure 1. Developmental profiles of autophagy. (A and A’) LysoTracker Red staining (red, 40×) of the fat body from 4L-2 to PP2. The inset in (W) shows that LysoTracker (red) and DAPI (blue) stain the cytoplasm and the nuclei, respectively. The chart (A’) shows the quantification of LysoTracker Red staining in (A). (B–B”) TEM analysis of the fat body from 5L-4, W and PP2 animals. The arrows indicate a lipid droplet (red, 5L-4) or an autolysosome (green, W; blue, PP2). The inset in (W) shows a double membrane-bound vesicle autophagosome. (B’) (30,000×) shows magnifications of portions of the image in (B) (7,500×). Note the remnants of organelles and the undigested materials in the autolysosomes. The chart (B”) shows the quantification of autophagosomes and autolysosomes in (B). (C) ATG8 protein level in the fat body from 4L-2 to PP2. ATG8-I and ATG8-II are the nonlipidated and lipidated forms of ATG8, respectively. Tubulin was used as a loading control for the western blotting analysis. (D) Measurement of acid phosphatase (AP) activity in the fat body from 4L-2 to PP2. 4L-2, day 2 of the 4th instar, and so on; 4M, the 4th molting; W, the wandering stage; PP1, day 1 of the prepupal stage, and so on.

An official website of the United States government
Here's how you know
Official websites use .gov
A
.gov website belongs to an official
government organization in the United States.
Secure .gov websites use HTTPS
A lock (
) or https:// means you've safely
connected to the .gov website. Share sensitive
information only on official, secure websites.
