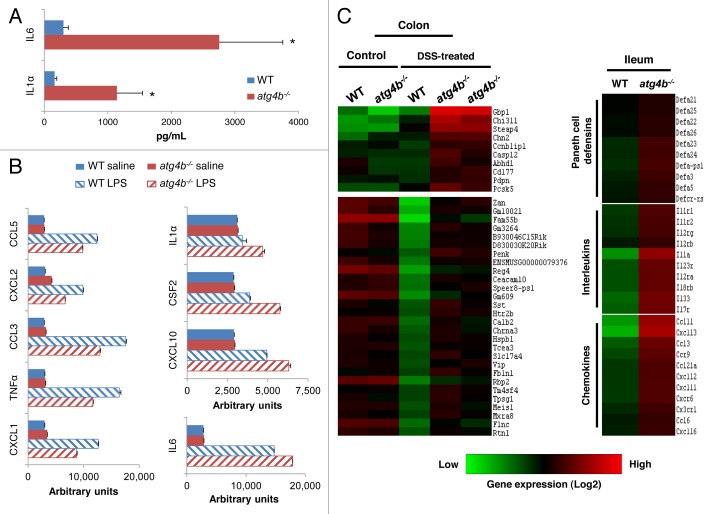
Figure 3. Deregulated secretion of proinflammatory cytokines in colon from atg4b−/− mice. (A) Protein level of the proinflammatory cytokines IL1Aand IL6 in colon tissue extracts from DSS-treated WT (n = 8) and atg4b−/− mice (n = 7). (B) Protein level of cytokines secreted by macrophages from WT (n = 5) and atg4b−/− mice (n = 5) after their exposure to LPS in vitro. (C) Microarray analyses of the colon and ileum from atg4b−/− and WT mice. A heat map representing the expression profiles of genes with significant differential expression when comparing WT vs. atg4b−/− colon from control and DSS-treated mice (left) or WT vs. atg4b−/− ileum from control mice (right) is shown, displayed as Log2-transformed expression signals. The results shown are means ± SEM. Statistical significance was determined by Student’s t-test (*p < 0.05).

An official website of the United States government
Here's how you know
Official websites use .gov
A
.gov website belongs to an official
government organization in the United States.
Secure .gov websites use HTTPS
A lock (
) or https:// means you've safely
connected to the .gov website. Share sensitive
information only on official, secure websites.
