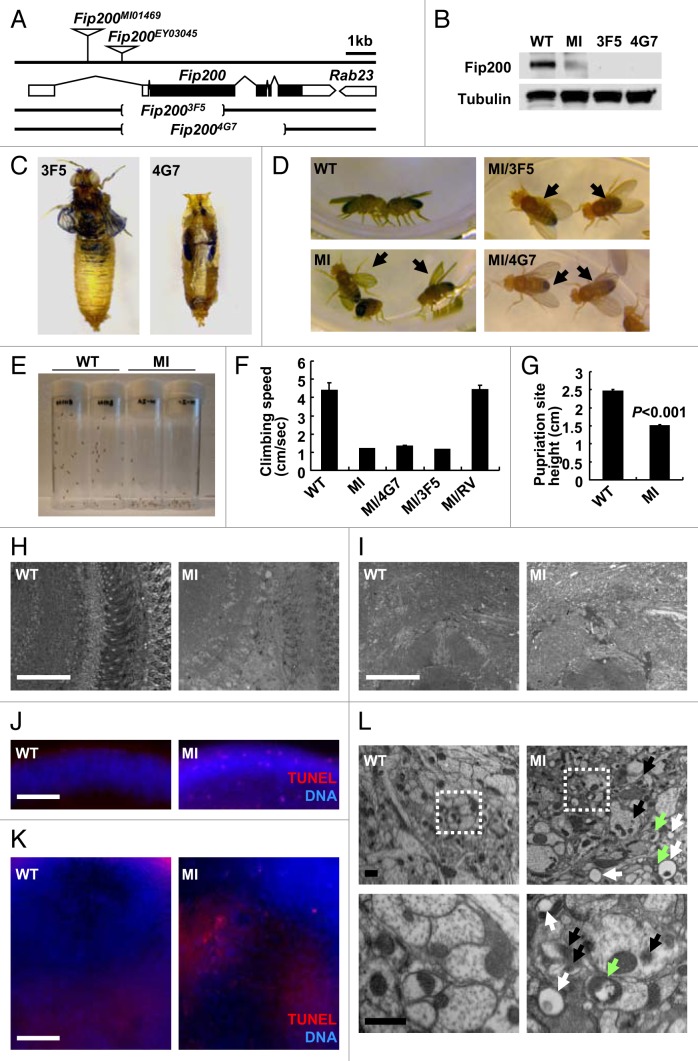
Figure 2. Phenotypes of Drosophila Fip200 mutants. (A) Schematic genomic organization of the Fip200 (CG1347) locus and Fip200 mutants. Brackets indicate the genomic deficiency in Fip200-null alleles. Triangles indicate transposon insertions. Open boxes: untranslated exons; closed boxes: protein-coding exons; size bar: relative length of 1 kb genomic span. (B) Absence of Fip200 protein in Fip200 mutant flies. Protein samples from wandering third-instar larvae of wild type (WT; Fip200+/+), MI (Fip200MI/MI), 3F5 (Fip2003F5/3F5) and 4G7 (Fip2004G7/4G7) were gel separated and immunoblotted with anti-Fip200 and anti-tubulin antibodies. (C) Pupal (pharate adult) lethality of Fip200-null mutants. Most of the 3F5 and 4G7 mutant flies die before or during eclosion. (D) Wing posture defects of Fip200 hypomorphs. WT, MI, MI/3F5 (Fip200MI/3F5) and MI/4G7 (Fip200MI/4G7) adult male flies. Complete phenotypic description of each mutant strain is summarized in Table S1 and S2. (E–G) Mobility defects of Fip200 hypomorphs. (E) A photograph of vials containing 2-week-old WT and MI flies taken 3 sec after negative geotaxis induction. (F) Quantification of climbing speed of the indicated 2-week-old adult male flies (n ≥ 10). Complete statistical comparison between each strain is summarized in Table S3. (G) Quantification of pupariation site height of the indicated fly strains (n > 480). (H and I) Semi-thin section of 2-week-old adult fly brain. Optic lobe (H) and central brain (I) regions were magnified to reveal moderate vacuolization in MI mutant brain. (J and K) TUNEL (red) and DAPI (blue, DNA) staining of 2-week-old adult fly brain. Optic lobe (J) and central brain (K) regions of MI mutant brain shows moderate apoptosis induction. (L) Electron micrographs reveal the presence of ectopic vacuoles (white arrows), inclusion bodies (black arrows) and dysfunctional mitochondria (green arrows) in 2-week-old MI brain (right panels) but not in wild-type control brain (left panels). Lower panels are magnified view of boxed regions in upper panels. Scale bars: 50 μm (white), 2 μm (black). Quantification data are represented as means ± standard error. p value was calculated using Student’s t-test. Approximate molecular weights (observed/predicted): Fip200 (150 to 200/152 kD), Tubulin (50/52 kD).

An official website of the United States government
Here's how you know
Official websites use .gov
A
.gov website belongs to an official
government organization in the United States.
Secure .gov websites use HTTPS
A lock (
) or https:// means you've safely
connected to the .gov website. Share sensitive
information only on official, secure websites.
