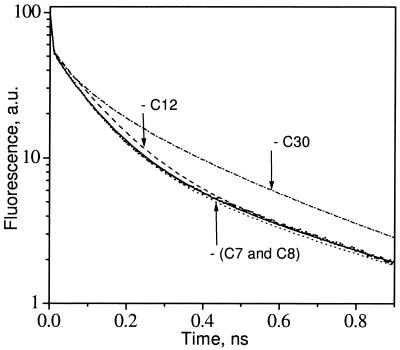
Figure 3.
PSII fluorescence-decay kinetics obtained from a global lifetime analysis of the PSI-less strain of Synechocystis 6803 (small filled dots) compared with the decay calculated with the kinetic model (solid line). Dashed, dash-dotted, and dotted lines represent fluorescence decays predicted with the model if C12, C30, or both ChlZ (C7 and C8), correspondingly, were removed. a.u., arbitrary units.

