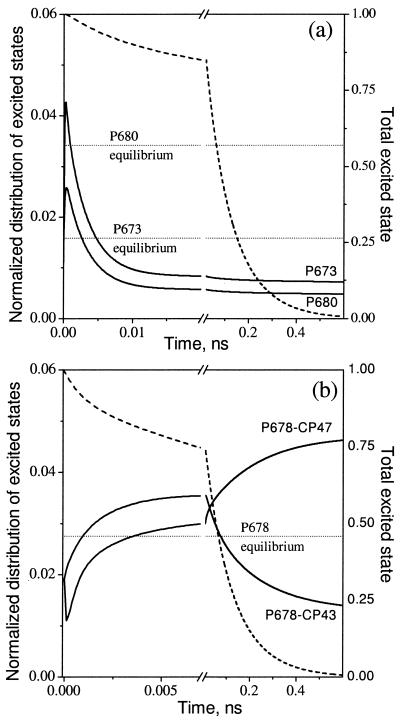
Figure 4.
Time-resolved excited-state distributions (solid lines) calculated from the kinetic model with 664-nm excitation compared with the Boltzmann equilibrium distributions for the same pigments (dotted lines). The excited-state distributions are presented for P680 and a representative pigment P673 (the D1 Chl) in the RC (a), and for a representative antenna pigment (P678) in CP43 and in CP47 (b). The excited-state distributions have been normalized to the total amount of excitation remaining at any given time (dashed lines).

