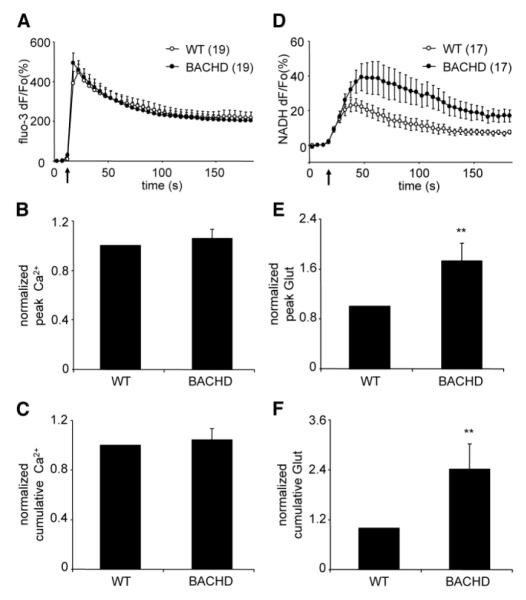
Figure 2. Cultured cortical astrocytes from BACHD mice exhibit the same cytosolic Ca2+ responses, but augmented glutamate release in response to mechanical stimulation when compared to cortical astrocytes from WT mice.
(A) Average kinetics of the fluo-3 fluorescence indicating the change in cytosolic Ca2+. (B) Normalized fluo-3 peak fluorescence values of mechanically-stimulated astrocytes. (C) Normalized fluo-3 cumulative fluorescence values obtained from mechanically-stimulated astrocytes. (D) Average kinetics of the NADH fluorescence reporting on glutamate released by astrocytes. (E-F) Normalized peak (E) and cumulative (F) glutamate (Glut) release from mechanically-stimulated astrocytes. BACHD astrocytes display significantly higher peak and cumulative glutamate release than WT control astrocytes. Points and bars represent means ± SEMs of measurements from solitary astrocytes (numbers for A-C and D-F listed in parentheses of A and D, respectively) expressed as dF/Fo (percentage) or normalized (ratio to control), while arrows (in A and D) represent the time when mechanical stimulation was applied to the cells. Asterisks denote significant change in comparison to control (WT) group (Mann-Whitney U-test, **p<0.01).

