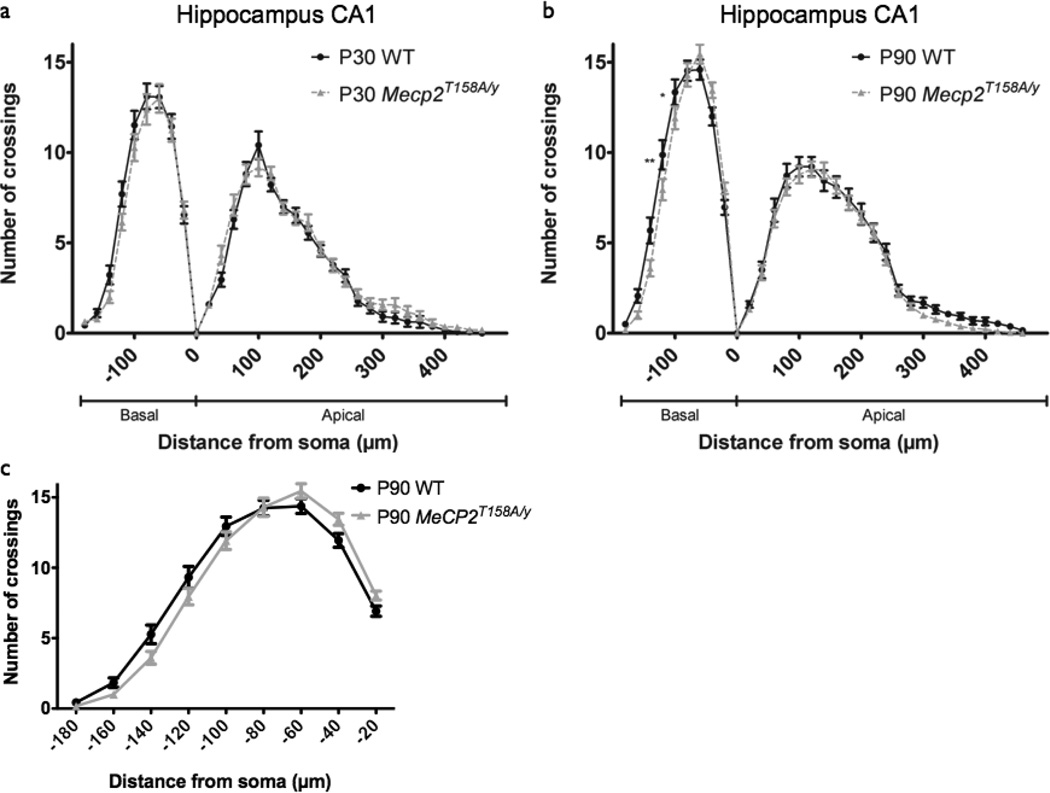
Figure 4. Dendritic complexity in hippocampus CA1 of Mecp2T158A/y mice.
(a) Sholl analysis of hippocampal CA1 pyramidal neurons in P30 WT (27 neurons from 5 mice) and Mecp2T158A/y mice (n=33 neurons from 5 mice) show no change dendritic complexity in Mecp2T158A/y mice relative to WT. Two-way ANOVA, p>0.05. Bars represent mean ± sem.
(b) Sholl analysis of hippocampal CA1 pyramidal neurons in P90 WT (n=32 neurons from 5 mice) and Mecp2T158A/y mice (n=40 neurons from 5 mice) show altered dendritic complexity in Mecp2T158A/y mice relative to WT specifically in the basal dendritic arbor. Two-way ANOVA with Bonferroni correction, p<0.0001 (interaction); *p<0.05, **p<0.01.
(c) Sholl analysis of basal dendritic complexity of hippocampal CA1 pyramidal neurons in P90 WT and Mecp2T158A/y mice show no difference in peak number of crossings in Mecp2T158A/y mice relative to WT.

