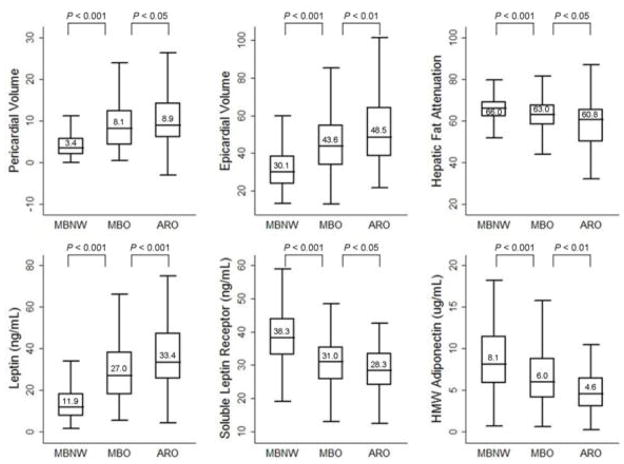
Figure 2.
Box plots representing median levels of ectopic fat and three adipokines by body size phenotypes.
Pericardial and epicardial fat measures are presented as volumes (more volume, more fat); hepatic fat measure is presented as attenuation (more attenuation, less fat). Horizontal lines represent medians, while bottom and top of the boxes represent the 25th and 75th percentiles, respectively.
MBNW = metabolically benign normal weight phenotype (n = 251). MBO = metabolically benign overweight/obese phenotype (n = 296). ARO = at-risk overweight/obese phenotype (n = 89).
Metabolically benign phenotype was defined as no more than 1 of the following 4 ATP-III components: (1) systolic/diastolic blood pressure ≥130/85mmHg, (2) fasting triglycerides ≥150 mg/dL, (3) HDL-C <50 mg/dL, and (4) fasting glucose ≥100 mg/dL.

