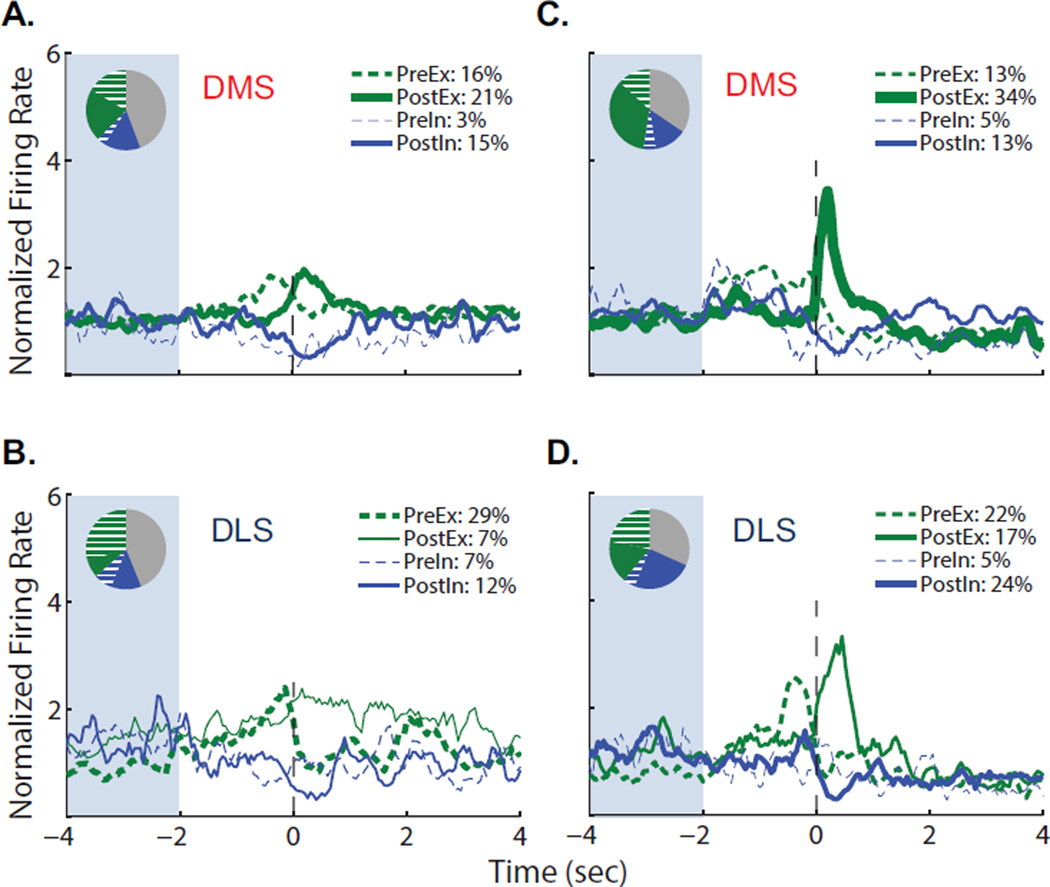
Figure 7.
Distribution of specific firing patterns of dorsal striatal neurons of VI30-trained rats around repeated operant events. DMS (top) and DLS (bottom) neurons were classified by the epoch and direction of significant changes in firing rate to each repeated intra-session event (PreEx: pre-excitatory; PreIn: Pre-inhibitory; PostEx: post-excitatory; PostIn: post-inhibitory; NP: non-phasic; see methods for category criteria): (A, B) non-reinforced lever responses; (C, D) reinforced lever responses. Line thickness is proportional to the number of neurons in each category, such that thicker lines represent greater proportions of neurons; NP neuronal activity is not shown. Firing rates were binned with a 250ms moving average using 50ms steps. Inset: pie charts display the proportions of cells in each category (see legend for color key; NP neurons shown in gray).

