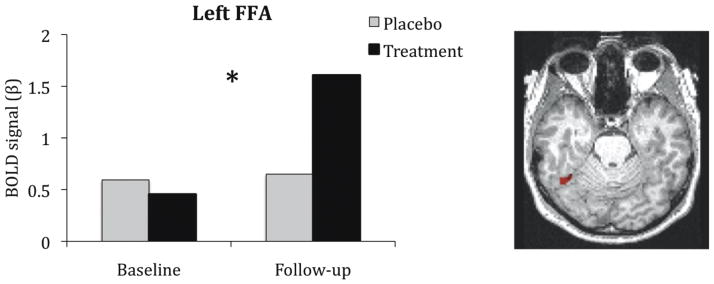
Figure 3. Increased Activity in the Left FFA ROI for Face Encoding.

The BOLD signal in the left FFA region of interest, defined by an independent localizer task. The left FFA showed a significant group-by-visit interaction, as indicated by the asterisk (*), in which the BOLD signal increased for the treatment group and remained constant in the placebo control group, relative to baseline. This ROI displayed on a representative native T1-image was used as a seed for functional connectivity analysis to explore network-based changes associated with ACh upregulation.
