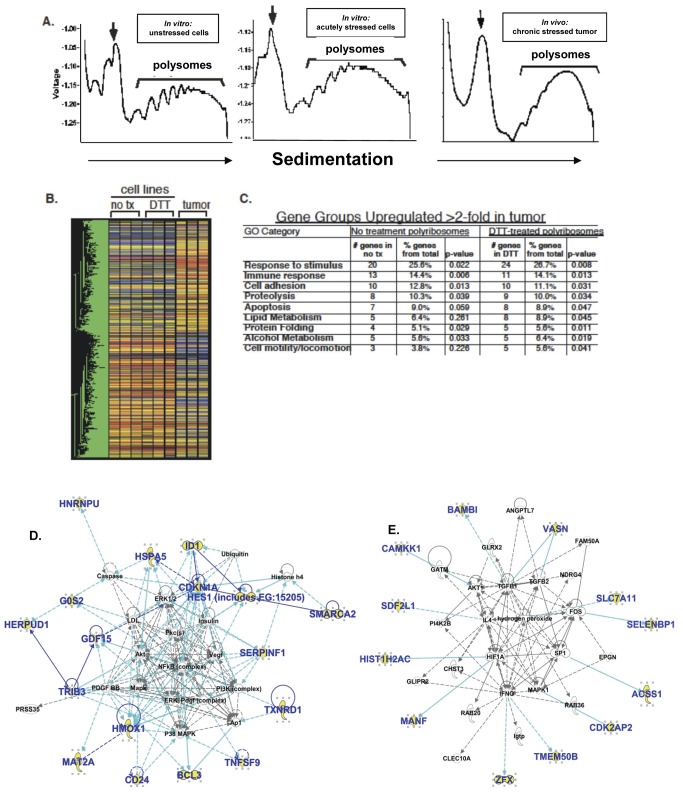
Figure 5. cDNA microarray analysis of polyribosome-engaged transcripts in control and UPR-activated cells and xenograft glioma tumors.
(A) Polyribosome traces from U87MG glioma models experiencing (or not) various stresses: unstressed cells, DTT-treated (acutely) stressed cells, and xenograft tumor-derived samples (“in vivo chronic stressed tumor”). Each sample was analyzed in triplicate. Following homogenization, sample lysates were layered over a linear sucrose gradient (15-50%), separated at 150,000X g for 3 hours and processed as described (Figure S2). Polyribosome-containing regions were pooled, total RNA extracted and submitted to the Duke Microarray Facility for analysis. (B) Heatmap of triplicate samples with one-way ANOVA analysis (P<0.01). Note the major distinctions between solid tumor polysome mRNAs and those of the cells in culture; over 1000 genes were differentially recruited to polysomes in solid tumors compared to tissue culture cells. (C) From the one-way ANOVA, p<0.01, genes with 2 of 3 replicates with a p<0.05 were selected. Listed here are GO groups and accompanying numbers of genes (GeneSpring) upregulated in tumor samples (> 2-fold, p<0.01) over either stressed or unstressed cells, with 5% or more of the total genes represented in the tumor. (D and E) Interactomes deduced from the 30 overexpressed genes sorted via Ingenuity Pathway Analysis; genes from the entry set are in bold blue; solid lines indicate direct connections between gene products, while dashed lines are indirect connections. Top Network/Associated Network Function in D is “Cell Death, Gene Expression, Free Radical Scavenging” with a network score of 44. Top Network/Associated Network Function in E is “Gene Expression, Cellular Development, Cell Death”, score = 27. The scores are –log (p values) (Fisher Exact Test).

