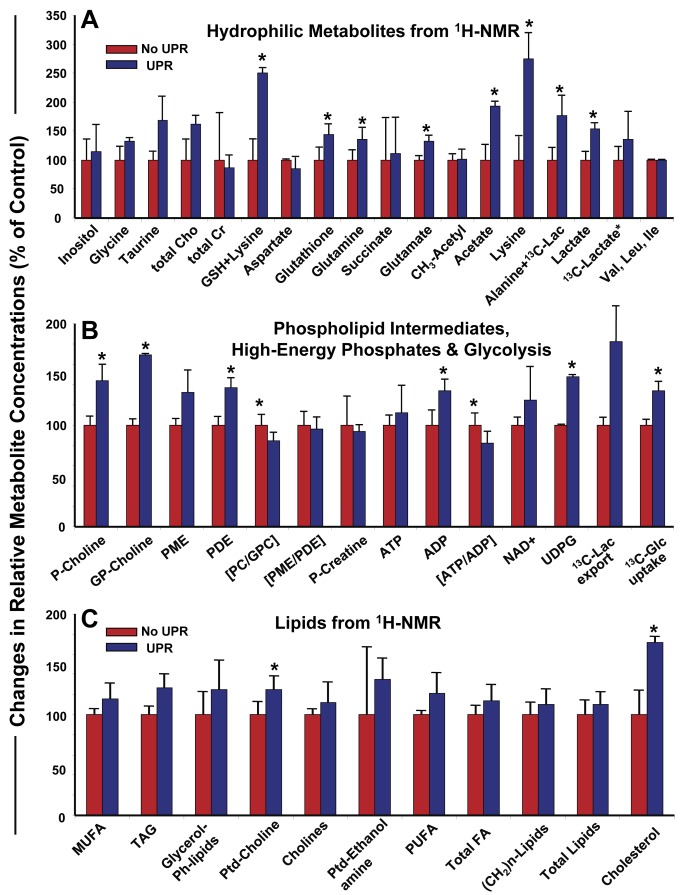
Figure 9. Relative metabolomic outputs of U87MG cells subjected to UPR stress compared to unstressed cells.
U87 cells were grown in Knockout DMEM medium with serum replacement as described above. Cells were harvested, washed, and replated in the same (fresh) medium with or without 1 mM DTT, and with 5 mM 13C-glucose, for 4 hrs prior to cell and media harvest and PCA extraction as described in Materials and Methods. 1H-, 31P-, and 13C-NMR spectra were obtained and quantified; data analyses were conducted as described. Graphs compare metabolite components from untreated cells (set to 100%) vs treated cells; error bars show standard deviation, and * = p< 0.05 derived from Student’s t test comparing treated to untreated in averages of 3 separate experiments. (A) displays data for soluble metabolites. Cho = choline; Cr = creatine GSH = glutathione; Lac = lactate. (B) displays data for high energy phosphates and [1-13C] glucose uptake. P-Choline = phosphocholine; GP-Choline = glycerophosphocholine; PME = phosphomonoesters; PDE = phosphodiesters; PC = phosphocholine; GPC = glycerophosphocholine; P-Creatine = phosphocreatine; UDPG = uridine diphosphoglucose; Glc = glucose; Lac = lactate. (C) shows data for lipid compounds. MUFA = monounsaturated fatty acids; TAG = triacylglycerols; Glycerol-Plipids = glycerol phospholipids; PtdCholine = phosphatidylcholine; PtdEthanolamine = phosphatidylethanolamine; PUFA = polyunsaturated fatty acids; FA = fatty acids.

