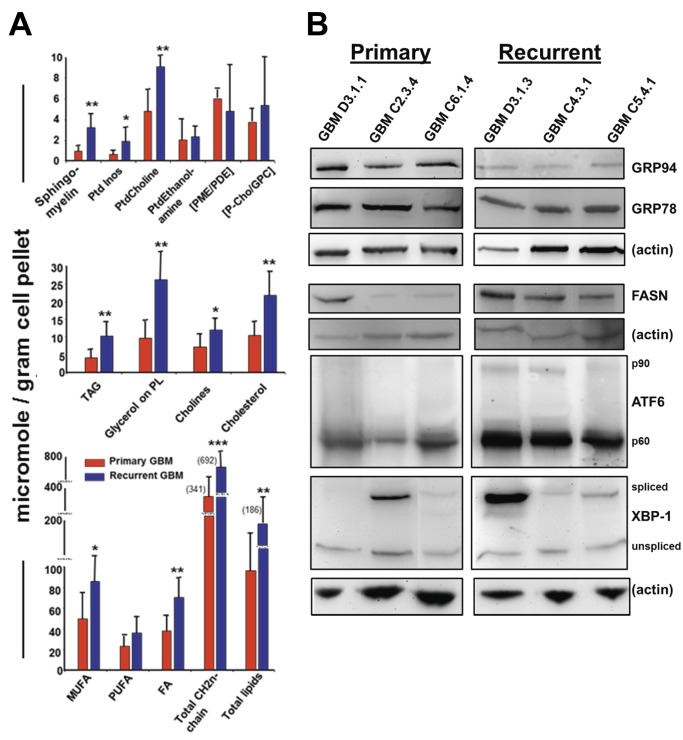
Figure 10. Recurrent gliomas show increased lipogenesis compared to primary gliomas, along with selective UPR pathway activation.
Four primary and six recurrent GBM frozen samples were randomly selected from tumor tissues archived in our Tumor Bank. Tumors were extracted as described; 1H- and 31P-NMR spectra were obtained and quantified with data analyses conducted as described. (A) Graphs compare metabolite components (as micromoles per gram of starting tissue material) from the averages of the primary tumors (red bars) to the average values obtained from the recurrent tumors (blue bars). Error bars show standard deviation, and * = p< 0.05; ** = p< 0.01; *** = p< 0.001 derived from Student’s t test comparing primary tumor quantities to recurrent tumor quantities. Ptd Inos = phosphatidyl inositol; PtdCholine = phosphatidylcholine; PtdEthanolamine = phosphatidylethanolamine; PME = phosphomonoesters; PDE = phosphodiesters; P-Chol = phosphocholine; GPC = glycerophosphocholine; TAG = triacylglycerols; PL = phospholipids; MUFA = monounsaturated fatty acids; PUFA = polyunsaturated fatty acids; FA = fatty acids. (B) Western blots of primary and recurrent tumor lysates (the samples for which there were sufficient remaining materials to perform the immunoblot analyses) probed with antibodies against UPR components GRP94, GRP78, ATF6, and XBP-1, as well as fatty acid synthase (FASN). Actin blots are shown as loading controls.

