
Fig. 3.
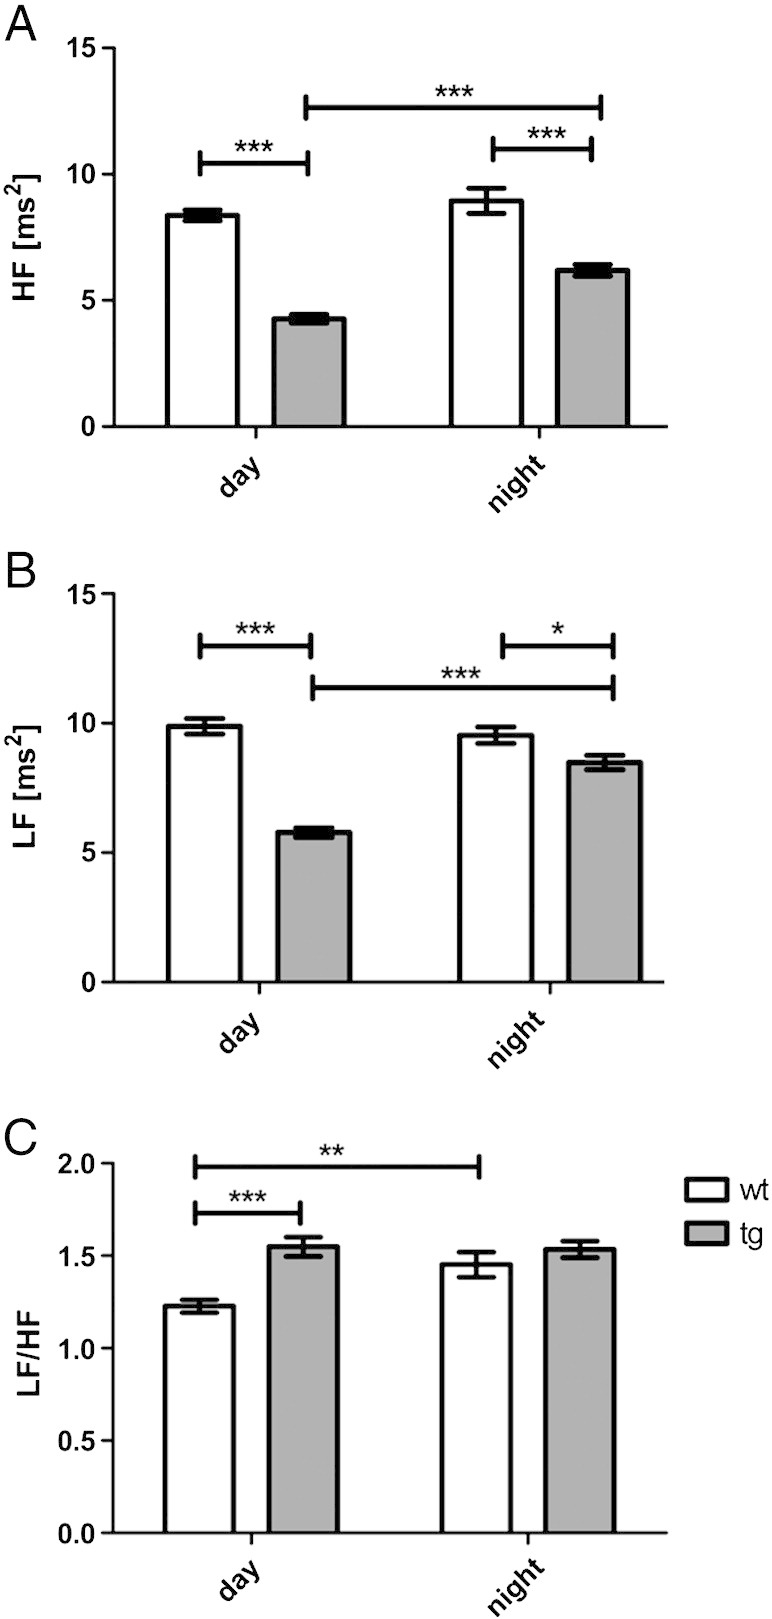
Frequency-spectrum analysis of five month old, male, wt and tg MSA animals. A) High frequency (HF) [ms2] representing vagal function, B) low frequency (LF) [ms2] illustrating sympathovagal balance and C) LF/HF ratio representing sympathovagal balance. Data are means ± S.E.M. n(tg) = 9, n(wt) = 7 animals.