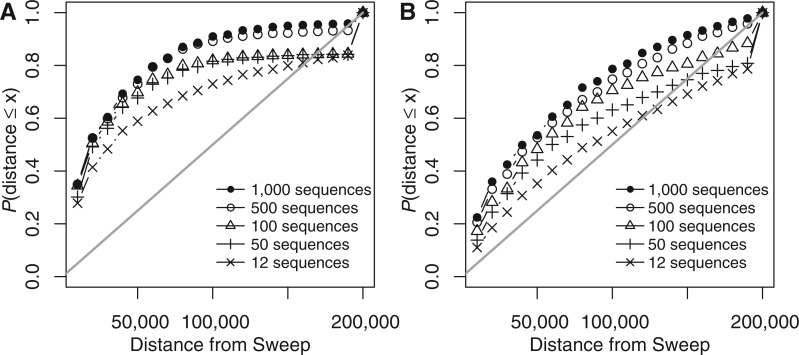
Fig. 3.
Assessment of the accuracy of predicting the selective sweep position for various sample sizes. The x axis in both plots shows the distance d of the reported selective sweep position from the true selective sweep position. Distance is grouped in bins of size 10,000, i.e., d1 = 10,000, d2 = 20,000, … , d20 = 200,000. For each bin i, the y axis shows the frequency of simulated data sets with a reported selective sweep position at a distance less than di. (A) Plot refers to a constant population model and (B) refers to a bottlenecked population model. Details regarding the simulation parameters are described in the main text. The straight line depicts the expected percentage of simulations at each bin, if the position of a reported selective sweep would be distributed uniformly along the simulated fragment of 400 kb. The figure shows that the accuracy of detecting selective sweeps increases with the sample size in both constant-size and bottlenecked populations. By comparing A with B, we see that the detection of a selective sweep is more accurate in constant-size than in bottlenecked populations.

