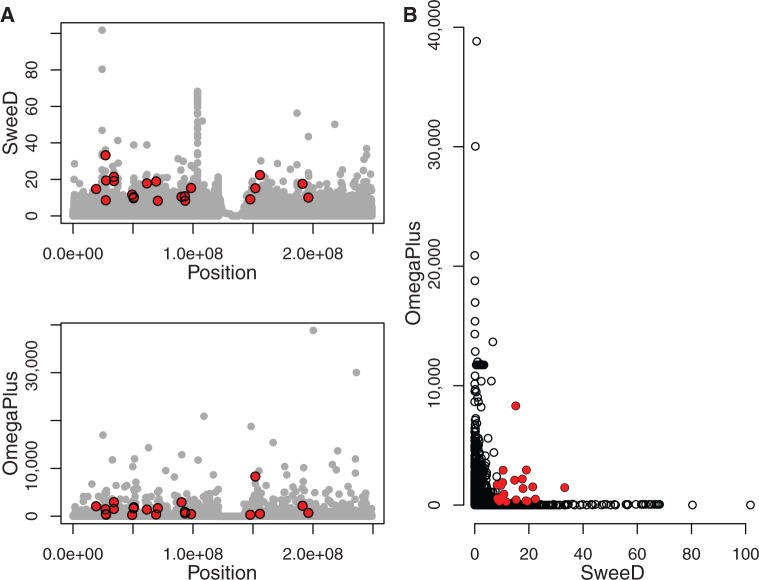
Fig. 4.
Scan of the human chromosome 1 for selective sweeps. (A) The x axis denotes the position on chromosome 1, and the y axis shows the CLR evaluated by SweeD (upper panel) and the ω-statistic (bottom panel) evaluated by OmegaPlus. (B) The joint plot for SweeD and OmegaPlus. Red points denote outliers at a significance level of 1%. The genes located in the outlier regions are described in the supplementary material (supplementary table S1 in supplementary section S4, Supplementary Material online).

