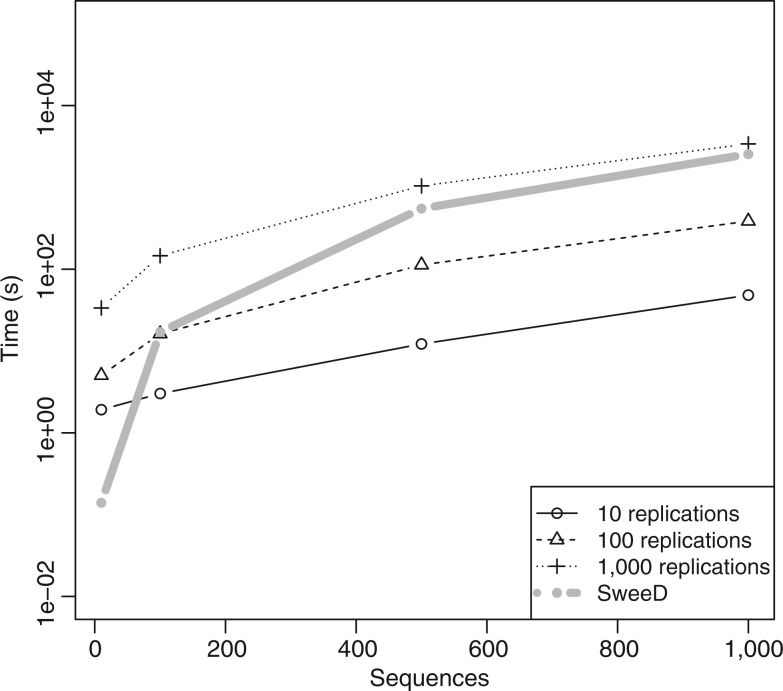
Fig. 5.
Comparison of the time (in seconds) required to estimate the average SFS by using either simulations or SweeD. The four thin black lines represent time needed by simulating a sample from a bottlenecked population 10 times (solid line), 100 times (dashed line), or 1,000 times (dotted line). Number of simulated replications affects the accuracy of estimation; more replications result in more accurate estimation (supplementary fig. S3 in supplementary section S5, Supplementary Material online). The thick gray line shows the time needed for SweeD (with the MPFR library) to estimate the average SFS of the same demographic scenario. The command line used for generating the simulated data sets is provided in the supplementary section S6, Supplementary Material online.

