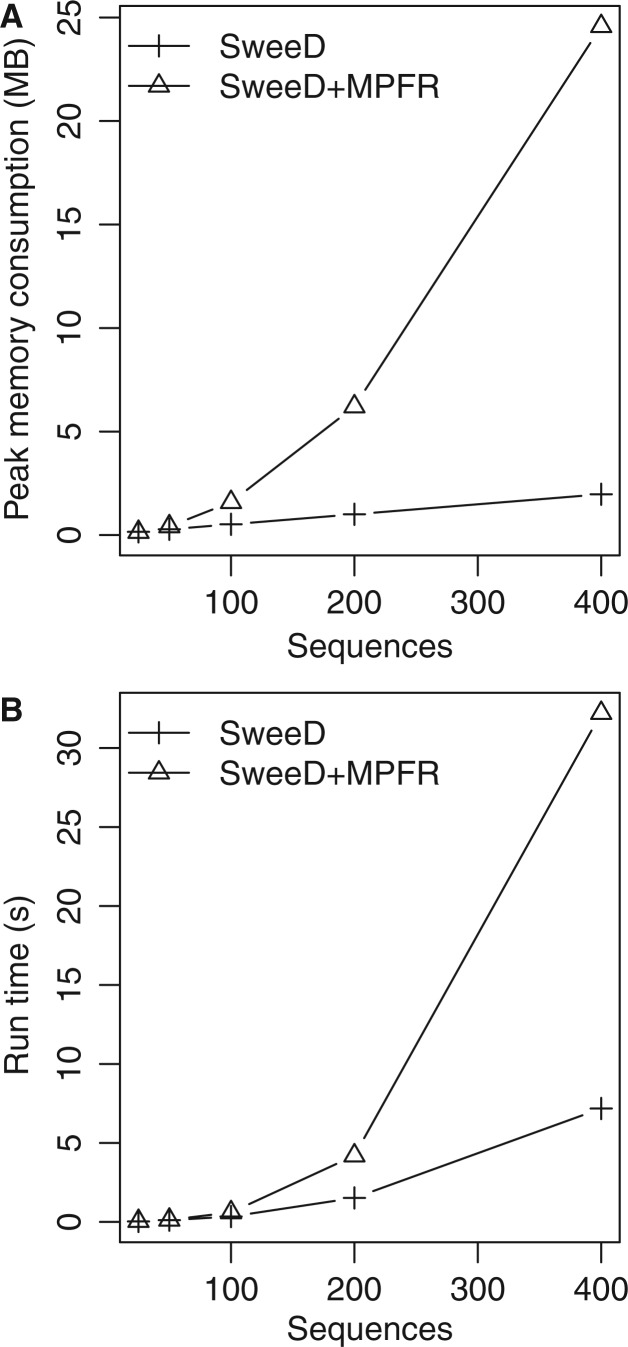
Fig. 6.
Comparison of memory consumption (A) and run-time (B) of SweeD (where the SFS is computed by the data itself) and SweeD using the MPFR library to calculate the analytical SFS. Simulated standard neutral data sets of 500 SNPs and 25, 50, 100, 200, and 400 sequences were used for the measurements. Memory consumption was quantified with the massif tool of the valgrind software (Seward and Nethercote 2005).

