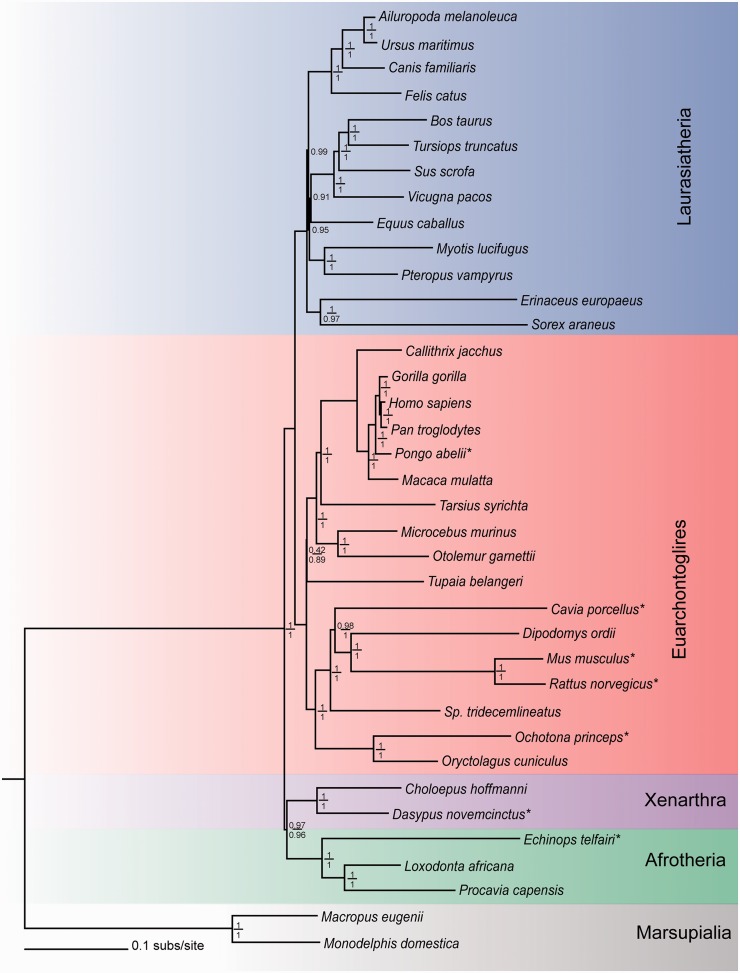
Fig. 3.
Mammal phylogeny reconstructed using two independent approaches. Phylogeny reconstruction carried out using CAT-GTR model on the 39TaxonSet_aa in PhlyoBayes v3.2 and on 39TaxonSet_day using the heterogeneous model 2GTR + 4C + 4Γ in P4. The support values for both methods are given at each node: the numerator is the Bayesian support value for nodes based on CAT-GTR in PhyloBayes; the denominator is the support value based on the 2GTR + 4C + 4Γ model in P4. Support values for the 2GTR + 4C + 4Γ model are shown where they are in agreement with the CAT-GTR model topology. The color scheme represents the major groups of mammals: red, Euarchontoglires; blue, Laurasiatheria; green, Afrotheria; purple, Xenarthra; gray, Marsupials (* represents compositionally heterogeneous taxa). Gallus gallus and Ornithorhynchus anatinus were both compositionally heterogeneous but were excluded in this figure to retain clarity of placental mammal branch lengths.

