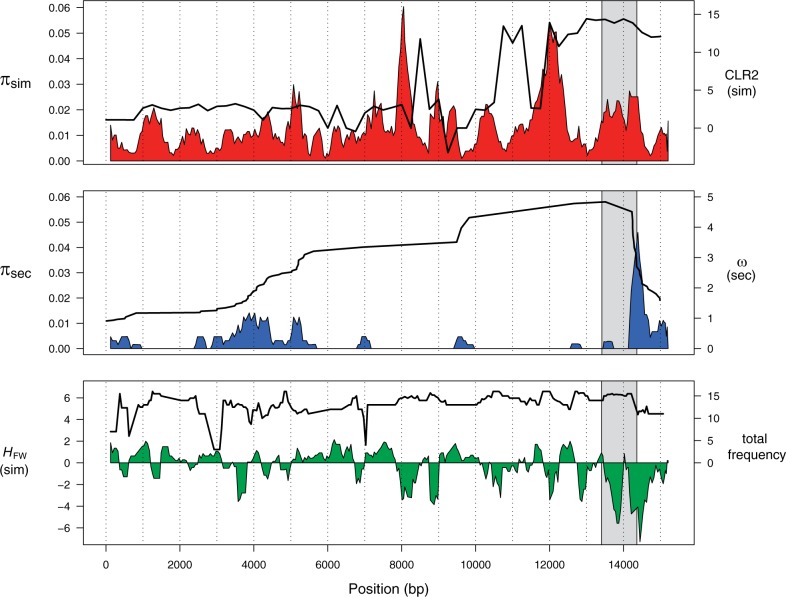
Fig. 3.
Spatial analysis of polymorphism across the 93A2 region and the putative target of natural selection. (A) Nucleotide diversity (π) for Drosophila simulans (red) and the CLR test of selection comparing the partial sweep to the complete sweep model (black line). (B) π for D. sechellia (blue) and the ω linkage disequilibrium statistic (black line). (C) Fay and Wu’s H statistic for D. simulans (green) and the frequency of derived sites shared by D. simulans and D. sechellia (black line). All analyses are performed in 250 bp windows with a step size of 50 bp. The gray box highlights the genomic region with the highest frequency of the core Ht1 haplotype (positions 12765–14364).

