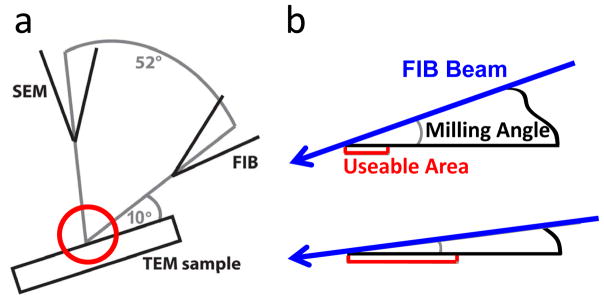
Figure 2.

Schematic of FIB milling. (a) Setup of the dual beam system. (b) Magnification of the red circle indicated in figure (a). The blue arrows indicate the FIB beam and the red area indicates the useable area for TEM imaging. The smaller the milling angle, the larger the useable area, in our experiments, this angle was ~9–11°.
