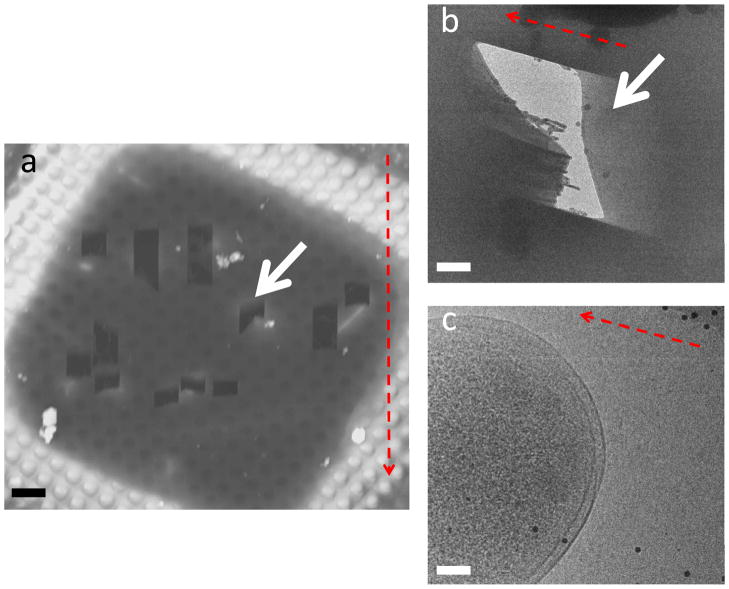
Figure 5.
Successful milling of E. coli cell. (a) SEM image taken from the FIB. The white arrow indicates the mill of interest. (b) Medium magnification TEM image of the E. coli cell. The white arrow shows the area of interest. (c) High magnification TEM image of the E. coli cell. The scale bars are (a) 5 μm, (b) 1 μm, and (c) 100 nm.

