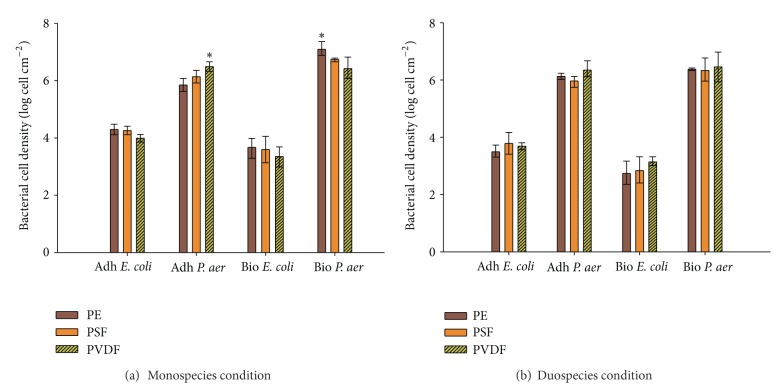
Figure 3.
Bacterial cell density expressed in log cells cm−2 membrane after adhesion and biofilm formation of P. aeruginosa and E. coli in monospecies (a) and duospecies (b) conditions on PE, PSF, and PVDF membranes. Cells were enumerated using standard plating and log transformed before analysis. Error bars represent standard deviation (n = 3). P. aer = P. aeruginosa, Adh = adhesion, Bio = Biofilm, and * = significantly different.

