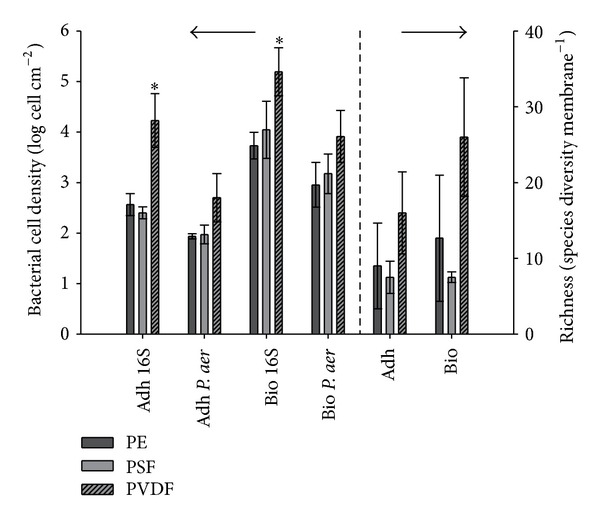
Figure 4.

Bacterial cell density (left axis) and species richness (right axis) expressed, respectively, as log cells and species diversity cm−² membrane when diluted activated sludge spiked with P. aeruginosa was used as biofoulant. The bacterial cell density was enumerated with 16S and P. aeruginosa specific qPCR. The species richness was calculated as the sum of the number of peaks (OTU's) within each ARISA electropherogram. Error bars represent standard deviation (n = 3). P. aer = P. aeruginosa, Adh = adhesion, Bio = Biofilm, and * = significantly different.
