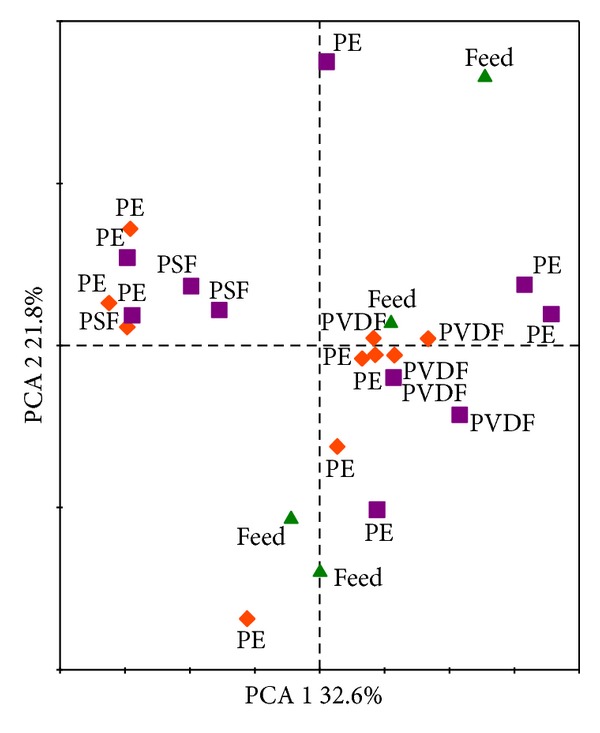
Figure 5.

PCA ordination diagram illustrating the relationships among the bacterial communities found on the PE, PSF, and PVDF membranes. The diagram is based in the height data of the ARISA data. Samples corresponding to the adhesion data are represented by squares and samples from the biofilm data by diamonds. The bacterial community in the culture vessel (feed) is plotted as triangles. The diagram shows the first and second PCA axes, that, respectively, account for 32.6% and 21.8% of the explained variability.
