
Figure 7. Lymphocytes numbers in the lungs after infection with HPAI virus.
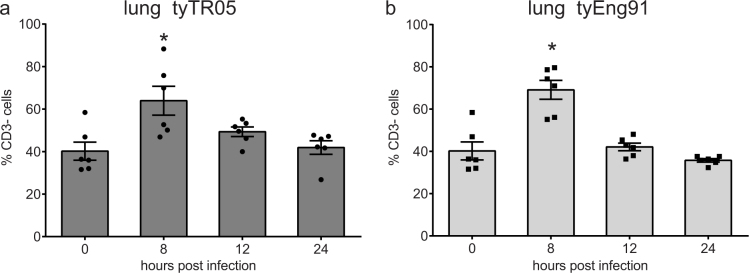
Percentages of lung CD3- cells within the live gate upon infection with tyTR05 (a) and tyEng91 (b) were analysed by flow cytometry. Mean ± SEM are shown (n = 6). Significant differences compared to the uninfected controls (0 hpi group) were analysed using Mann-Whitney tests and p < 0.05 is indicated by an asterisk.