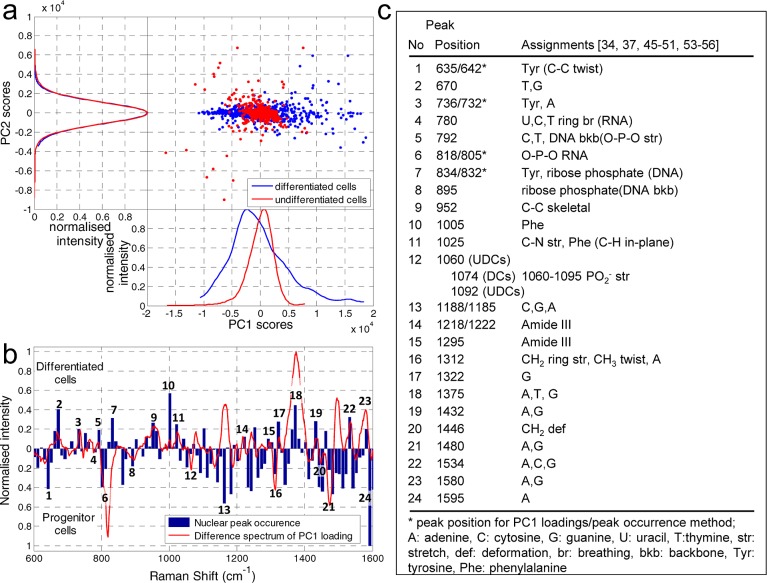
Figure 4.
Analysis of nuclear SERS spectra. (a) PCA analysis of nuclear spectra shown as a scatter plot and 1D intensity plots for PC1 against PC2 scores. The explained variance of the PC1 scores account for 61.5 and 93.5% for UDCs and DCs, respectively. PC1 scores allow for the correct cellular segregation of UDCs (red) and DCs (blue) as the results show distinct differences in mean and standard deviation. (b) Combined bar and line plots showing the normalized difference in the spectrum of nuclear peak occurrences (bars) and the PC1 loadings. DCs and UDCs are characterized by bars/peaks pointing to the upper and lower side of the plot, respectively. Marked peak positions (1–24) are assigned in (c).

