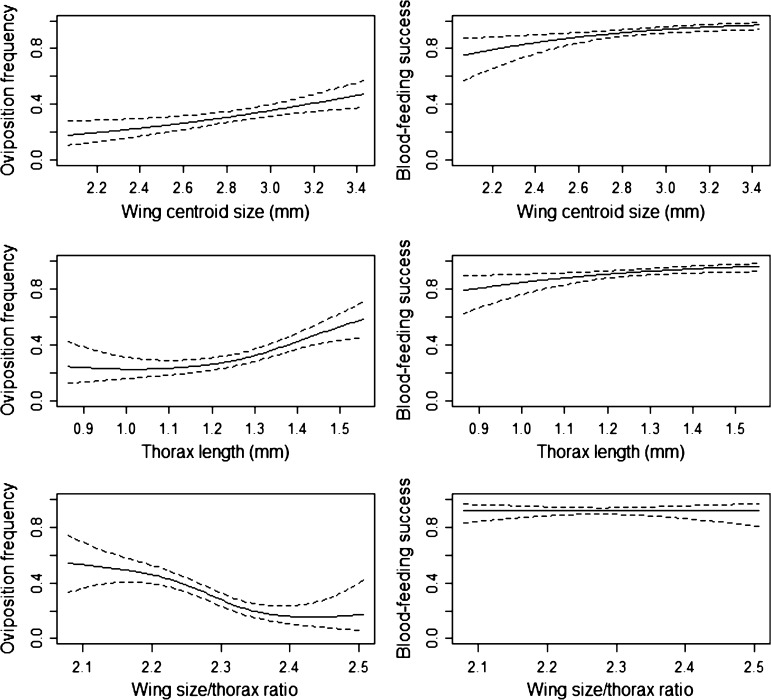
Figure 6.
Fitness function plots using cubic spline with Bayesian standard error based on wing centroid size, thorax length, and wing size/thorax ratio of Aedes aegypti. Fitness curves on the left assume only egg laying females from sticky ovitraps are fit. On the right, fitness curves consider successful blood-feeding as high fitness, which includes gravid, parous and sticky ovitrap females.

