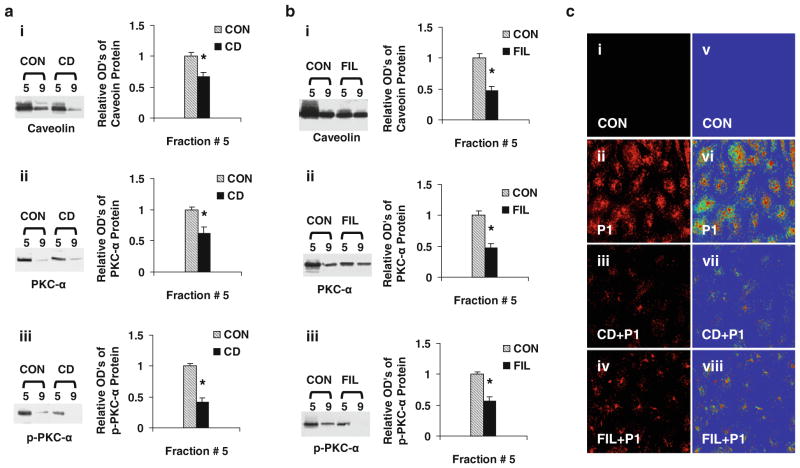
Fig. 2.
Caveolae disruptors (CD/FIL) reduces caveolar PKC-α phosphorylation and P1 internalization. ECs were pre-incubated with or without medium containing CD (5 mM) or FIL (0.05 μg/ml) for 60 min. After treatment, cells were washed and incubated with or without Rhodamine Red-labeled or non labeled P1 at 37°C for 60 min and used for confocal microscopy and isolation of caveolar-enriched fractions (#5) and a non-caveolar-enriched fraction (#9) as described in methods. The levels of caveolin, PKC-α, and p-PKC-α proteins in the fractions isolated from CD (a) and FIL (b) were assessed using Western blot analysis as described in methods. a, b Data are means ± SE; n = 4 for control and CD/FIL treatment group fraction #5. *P < 0.05 versus control. c The fluorescent micrographs (40×) of live cells pre-incubated with CD/FIL, treated with and without rhodamine red-labeled P1 were obtained using confocal microscopy (images i, ii, iii, iv). The rainbow palette micrographs (images v, vi, vii, viii) are generated on the same sets of data using the Zeiss LSM software

