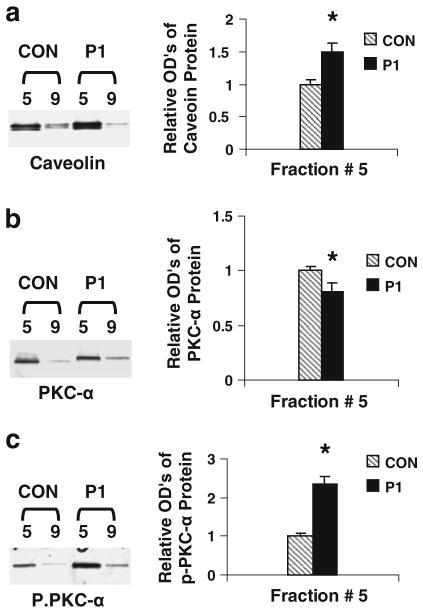
Fig. 4.
Assessments of caveolin, phosphorylated PKC-α, and total p-PKC-α protein levels. PAECs were incubated in medium containing P1 (100 μM) or vehicle at 37°C for 1 h. Differential sucrose density gradient centrifugation was used to separate caveolar-enriched fractions (#5) and a non-caveolar-enriched fraction (#9). The levels of caveolin, PKC-α, and p-PKC-α proteins in the fractions were assessed using Western blot analysis (insets). The band intensities were determined and shown as ODu’s (Optical Density Units/mm2). a The levels of caveolin in the caveolar-enriched and non-caveolar fractions derived from P1- or vehicle-treated cells. b PKC-α levels in the P1-treated or untreated fractions. c the effects of P1 on PKC-α phosphorylation (p-PKC-α). Data are means ± SE; n = 4 for control and P1 treatment group fraction #5. *P < 0.05 versus control for P1-treated samples

