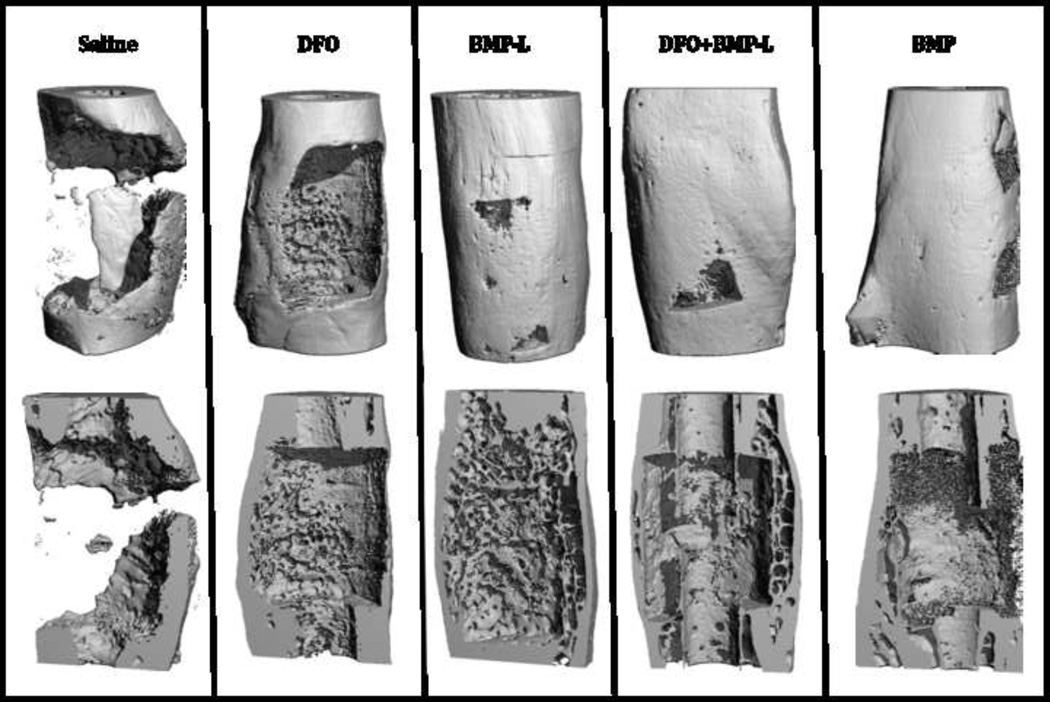
Figure 2.
µCT of bone healing at 12 weeks. Representative three dimensional reconstruction images are shown (top row). Sagittal cut-away reconstructed images (bottom row) show increased bone bridging in the treatment groups compared to no bony bridge noted in the saline group. The increases in bone volume in the treatment groups were not statistically significant.

