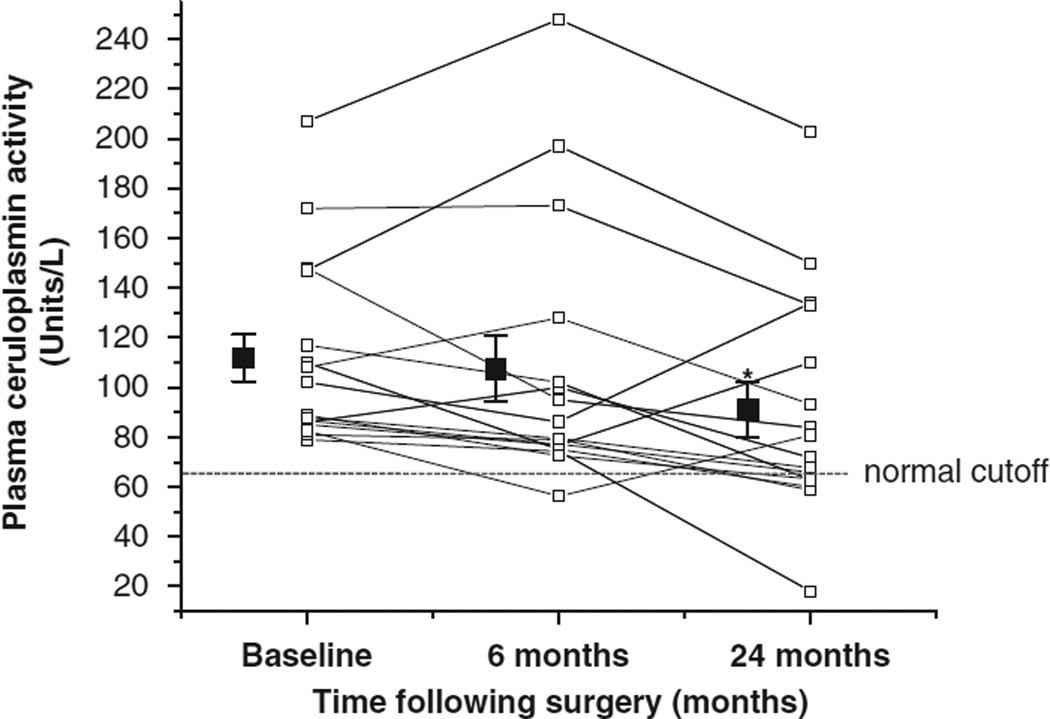
Figure 2.
Changes in plasma ceruloplasmin activity during 24 months following RYGB surgery. Ceruloplasmin activity was serially determined in study 2 subjects (n = 16) before (baseline), and 6 and 24 months following RYGB surgery and each individual data point is plotted (open squares). The mean and standard error of the mean for each timepoint is represented by closed squares. At 24 months following surgery, 3 ceruloplasmin activity values dropped below the normal cutoff.31 An asterisk (*) depicts values significantly different from baseline, P = 0.016.

