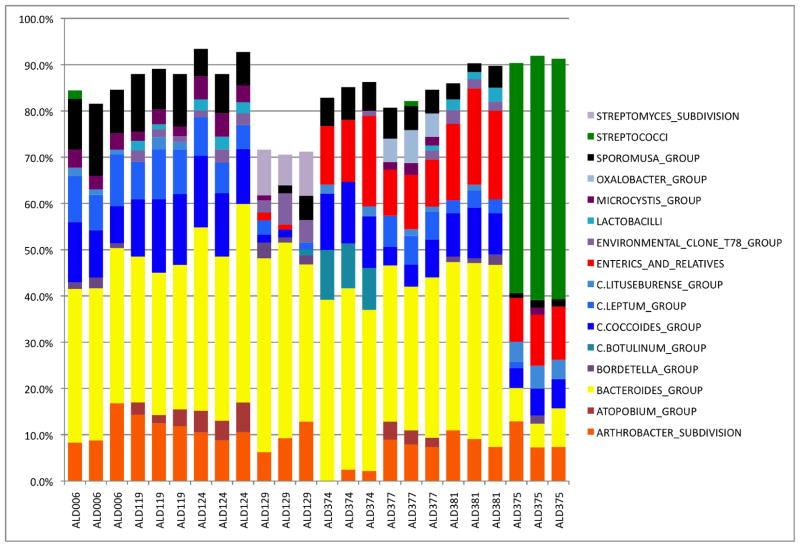
Figure 5. Multitag Pyrosequencing of Healthy Controls.
Figure 5 depicts a stacked histogram of the taxa abundance from replicates of Healthy Control microbiome samples. The taxa are identified using Level 4 of the RDP8 taxanomic hierarchy. Microbiome samples are labeled on the x axis and the normalized abundance is plotted on the y axis. The color code is defined in the inset on the right of the figure.

