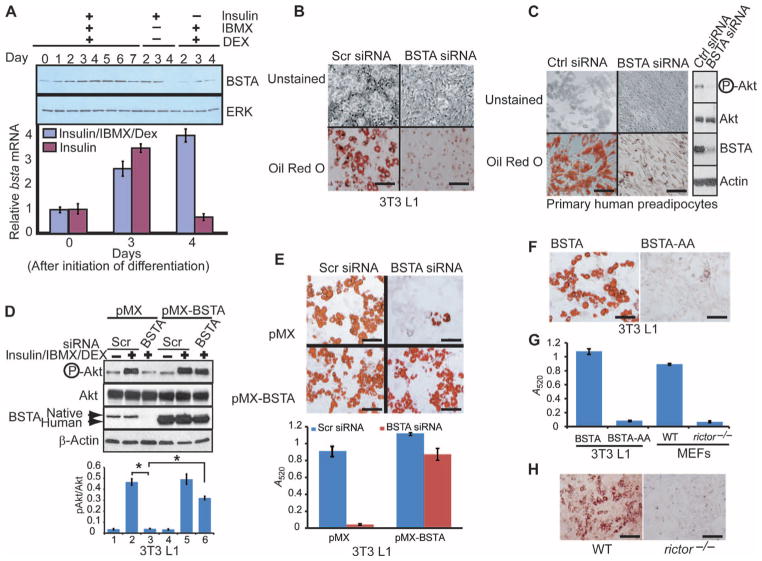
Fig. 5.
BSTA is essential for adipocyte differentiation. (A) 3T3 L1 preadipocytes treated as indicated were immunoblotted for BSTA and extracellular signal–regulated kinase (ERK). Total RNA from a second set of cells was used for qPCR analysis of bsta expression (graph), and averages and SDs obtained from three independent experiments are shown. (B) 3T3 L1 preadipocytes electroporated with scrambled (scr) or BSTA siRNA were differentiated with insulin/IBMX/dexamethasone (Dex) and stained with oil Red O. Scale bar, 100 μm. n = 5 experiments. (C) Primary human preadipocytes were electroporated with siRNA, induced to differentiate, and either immunoblotted to determine the phosphorylation status of Akt at Ser473 (right) or differentiated further and stained. Scale bar, 100 μm. n = 2 experiments. (D and E) 3T3 L1 cells expressing a control vector (pMX) or human bsta (pMX-BSTA) were electroporated with siRNA and either immunoblotted with the indicated antibodies (D) or differentiated further (E). Endogenous murine BSTA is less mobile than exogenous (human) protein. Densitometric data (n = 3 experiments) showing pAkt/Akt ratios (means ± SD; *P < 0.01) are presented below the representative blot (panel D). Oil Red O staining in (E) was quantified by measuring absorbance at 520 nm, and data from three independent experiments are presented (means ± SD). Scale bars, 100 μm. (F) 3T3 L1 cells overexpressing BSTA or BSTA-AA were induced to differentiate into adipocytes. Scale bars, 100 μm. n = 3 experiments. (G) Oil Red O staining for WT (F) and for rictor−/− MEFs (H) was quantified by measuring absorbance at 520 nm, and data from three independent experiments are presented (means ± SD). (H) Oil Red O staining for WT or rictor−/− MEFs induced to differentiate into adipocytes. Scale bars, 100 μm. n = 3 experiments.

