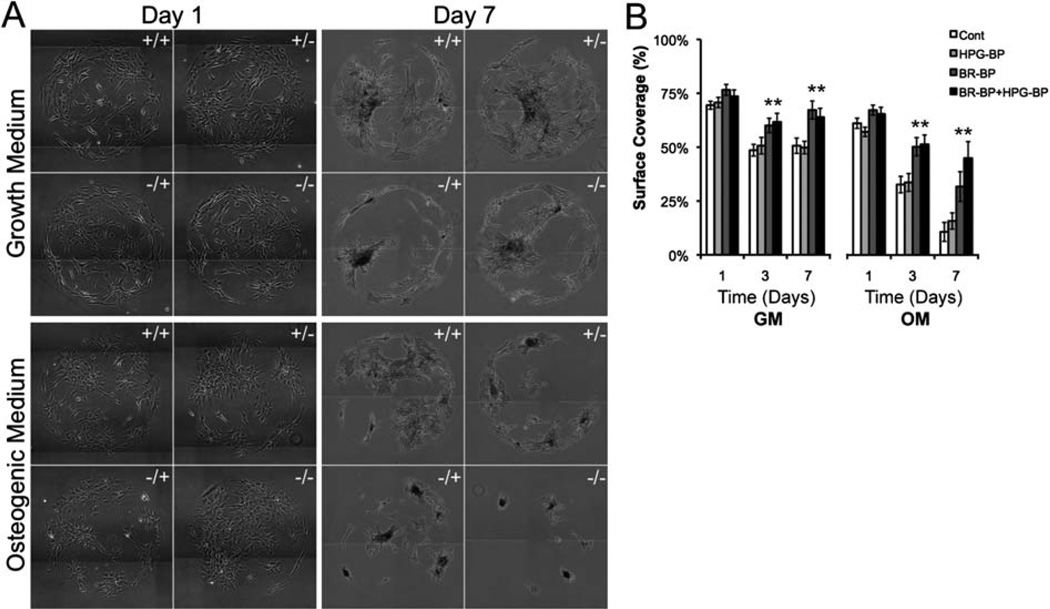
Fig. 3.
hMSC surface coverage on SAM arrays presenting mixtures of BR-BP and HPG-BP and a low density of GRGDSP in growth medium (GM) and osteogenic medium (OM). (A) Images of hMSCs on SAM array spots and (B) quantification of spot coverage. 1 × 10⁶ hMSCs were seeded onto each SAM array and media were changed every other day (“−/−” Control, “+/−” BR-BP, “−/+” HPG-BP, “+/+” BR-BP and HPG-BP. Error bars indicated standard error of the mean and asterisk indicates significance difference compared to control, p < 0.05, n = 9).

