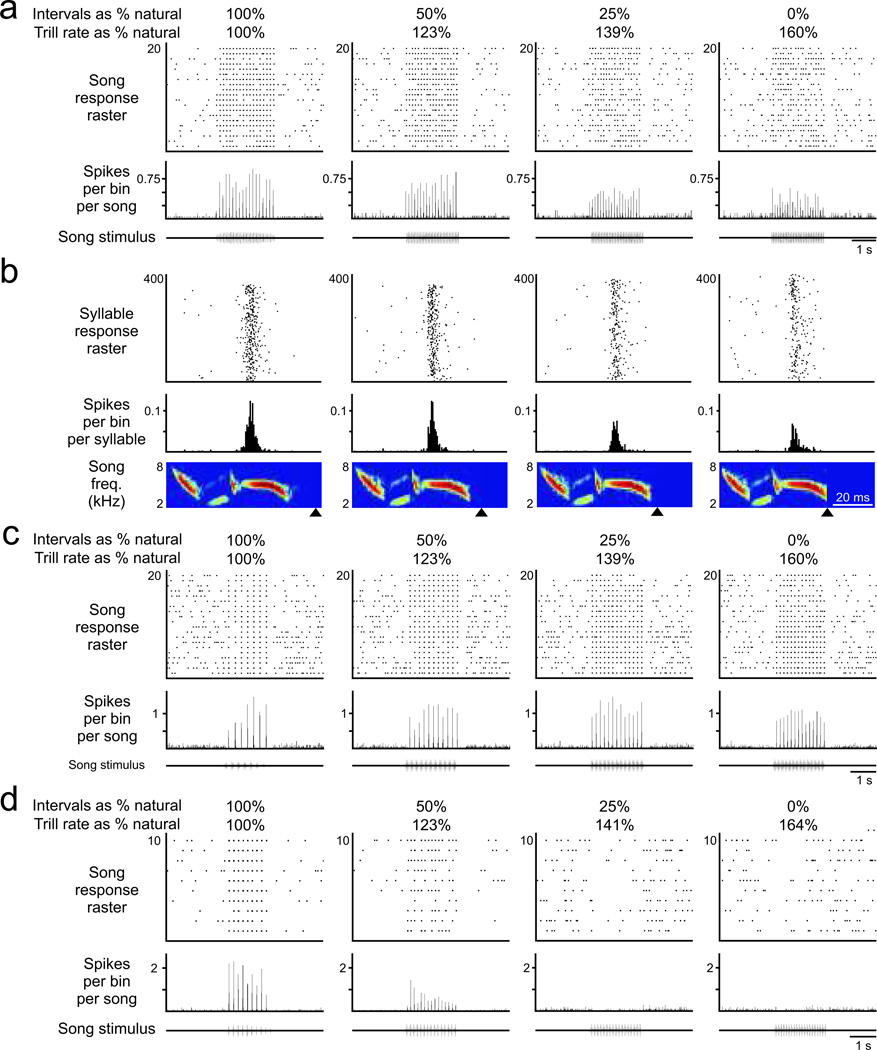
FIGURE 3.
The strength of auditory response in individual HVCX neurons typically declined with progressively more accelerated trill rates, but different cells within the same bird could express different types of response (N = 14 cells, 6 birds). a) The response of this cell, also shown in figure 2b–d, was typical of the HVCX population, with decreasing responses at higher trill rates (top: response raster for each song presentation; middle: histogram of aggregate auditory response; bottom: oscillogram of song stimulus). b) The response of the same cell as in panel a retained its precise relation to specific song features, revealing that reduced peaks in panel a reflect a lower probability of response to each syllable (top: raster of responses to each syllable; middle: histogram of aggregate auditory response; bottom: spectrogram of song syllable). Exceptions to this typical response were also evident. c) A different cell from a different bird maintained its response strength even at maximally accelerated trills. This was the only cell in which such maintenance of response was observed. d) A different cell from the same bird as in panel c expressed strong decrement in response to accelerated trills. The presence of the response in this panel and in panel c among cells in the same bird reveals that the HVCX population response comprises a diversity of responses to accelerated trills.

