Figure 3.

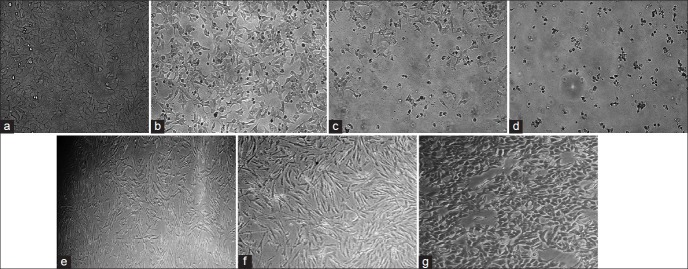
Representative invert microscopy images of MCF-7and MRC-5 cells before and after treatment with 85.43 μmol/L CTB at different times and the sample by using DMSO without CTB (vehicle DMSO), magnification, ×20

Representative invert microscopy images of MCF-7and MRC-5 cells before and after treatment with 85.43 μmol/L CTB at different times and the sample by using DMSO without CTB (vehicle DMSO), magnification, ×20