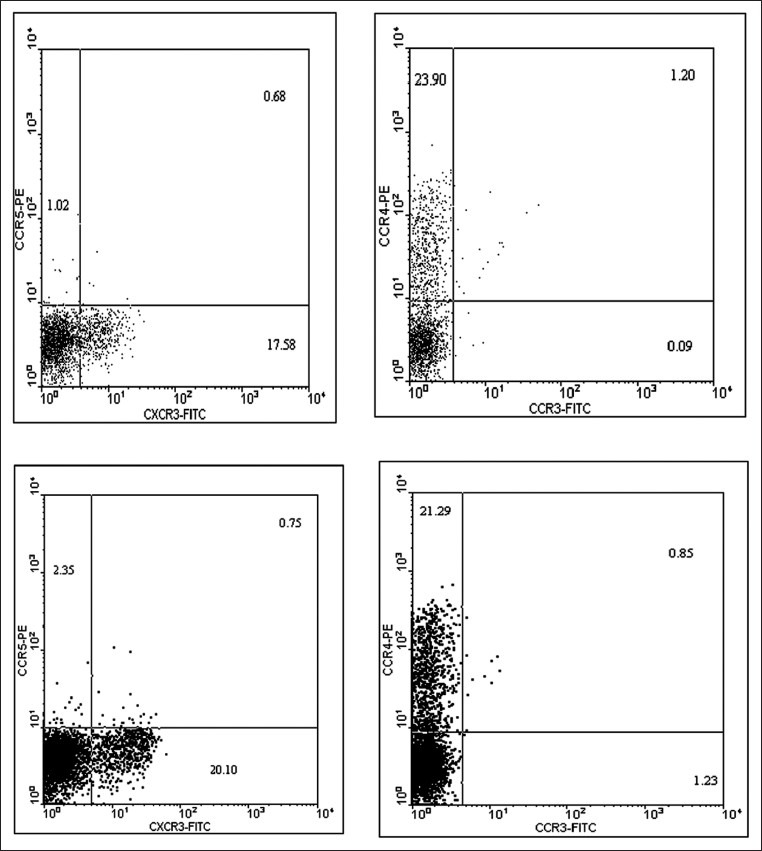
Figure 1.

Dot plot obtained from flow cytometry software analysis of PBMC sample of the patients with gastric cancer. Every dot in such figures represents a read cell (in some occasions, similar parameters of the same cells causes the dots to coincide on the plane). Each dot plot plane is divided into four quadrants by two perpendicular lines. The dots in the bottom left quadrant represent cellular control in non-stained samples as a standard for the studied cell population or in stained samples as the cell population without studied parameters. The upper left quadrant next to Y axis shows the percentage of cells stained with the marker connected to phicoeritrin (PE) and also shows negative Fluorescein Isothiocyanate (FITC). The bottom right quadrant indicates the percentage of cells stained by the marker connected to FITC and also shows negative PE. The upper right quadrant represents the percentage of cells possessing both markers connected to FITC and PE (or double positive). The provided plots are shown as representatives for the analysis of the studied chemokine receptors expressed on CD4 cells and the percentage of stained cells was considered in statistical calculations and is shown in Tables
