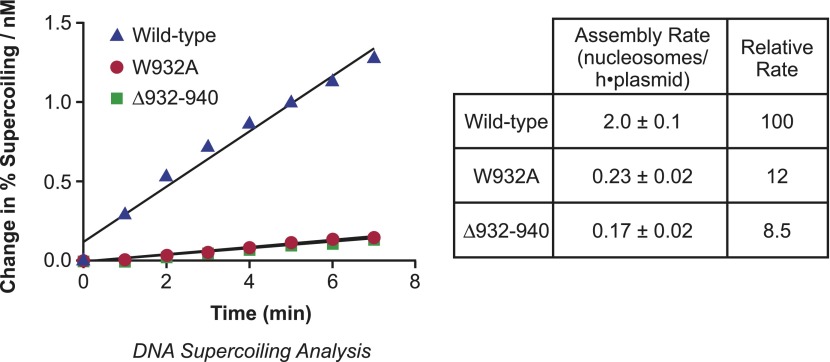
Figure 2. Analysis of the initial rates of nucleosome assembly by the wild-type, W932A, and Δ932–940 yChd1 proteins.
The initial rates were measured as change in % supercoiling ([Δ supercoiled DNA/total DNA] × 100%)/(nM protein) vs time (min). The table summarizes the nucleosome assembly rates as mean ± standard deviation (N = 3). The relative rates are given with respect to that of the wild-type protein.

