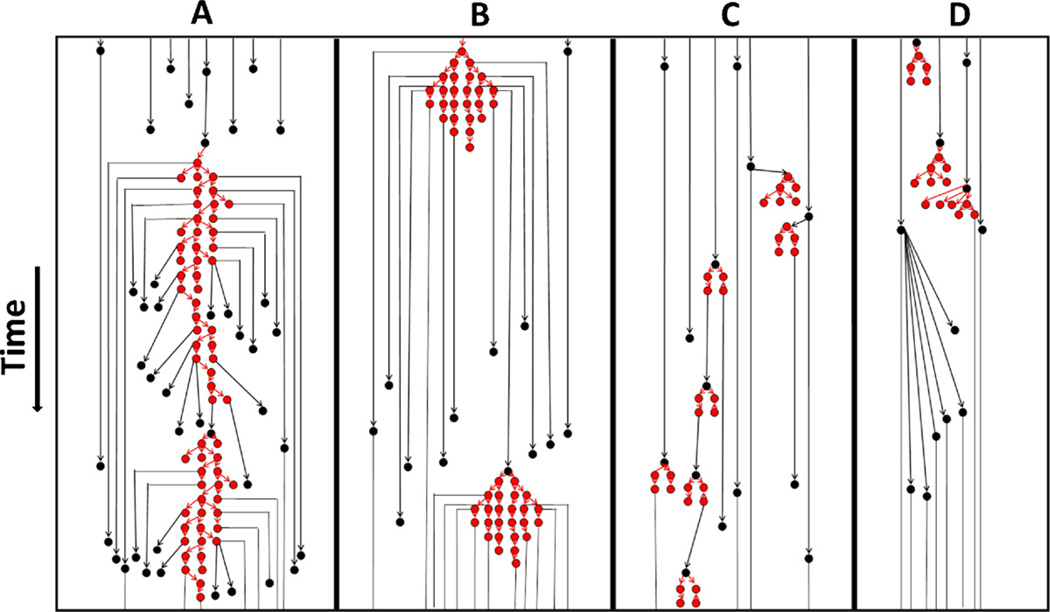
Fig. 1.
An illustration of four different hypothetical transmission systems (A–D) showing acute infection outbreaks of different sizes and shapes. Black circles: someone infected from a chronic infection source; red circles: someone infected from an acute infection source. Black arrows: transmissions during chronic stage; red arrows: transmissions during acute stage. (For interpretation of the references to color in this figure legend, the reader is referred to the web version of the article.)

