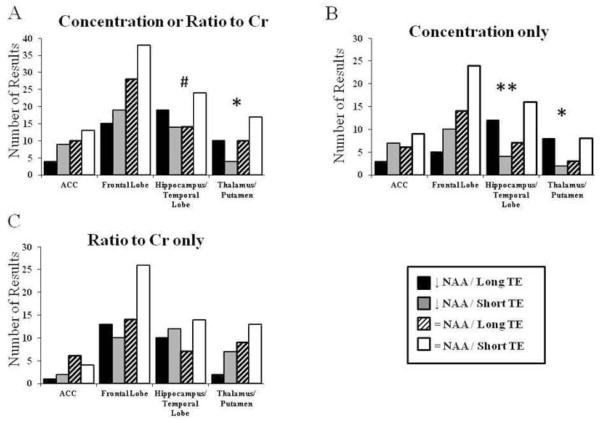
Figure 1.
Count of results organized by NAA concentration finding and TE methodology. This includes studies quantifying absolute NAA concentration for each region of interest from both quantification methods:-- normalizing to Cr or quantifying absolute NAA concentration (A), data from studies which only quantified absolute NAA concentration (B), and studies which only normalized to Cr (C). Data are separated by brain region. Data are expressed as a number of results. # = p < 0.10, * = p < 0.05, ** = p < 0.01

